


.jpg)
ในเดือนกุมภาพันธ์ที่ผ่านมา ราคา Bitcoin ลดลงทะลุ $60,000 เป็นครั้งแรกในรอบ 15 เดือน นับจากที่เพิ่งทำ All-time high ที่ $126,210 ไปเพียง 4 เดือนก่อน หลายคนมองว่านี่ไม่ใช่แค่การ Crash ธรรมดา แต่คือการ Unwind ของขาขึ้นครั้งใหญ่ที่ขับเคลื่อนด้วยปัจจัยที่ซับซ้อนกว่ารอบ 2022 มาก ไม่ว่าจะเป็นความไม่แน่นอนของนโยบายการค้า ความตึงเครียดทางภูมิรัฐศาสตร์ และท่าที Hawkish ของ Fed ภายใต้ประธานคนใหม่
คำถามที่ตลาดกำลังถามคือ นี่คือ Correction ชั่วคราว หรือจุดเริ่มต้นของ Bear Market ที่ยืดเยื้อ? บทความนี้จะวิเคราะห์ผ่านสัญญาณ Onchain, ปัจจัย Macro และพฤติกรรมของนักลงทุนสถาบัน เพื่อหาคำตอบว่าตอนนี้เราอยู่ตรงไหนของ Cycle และควรเตรียมตัวอย่างไร
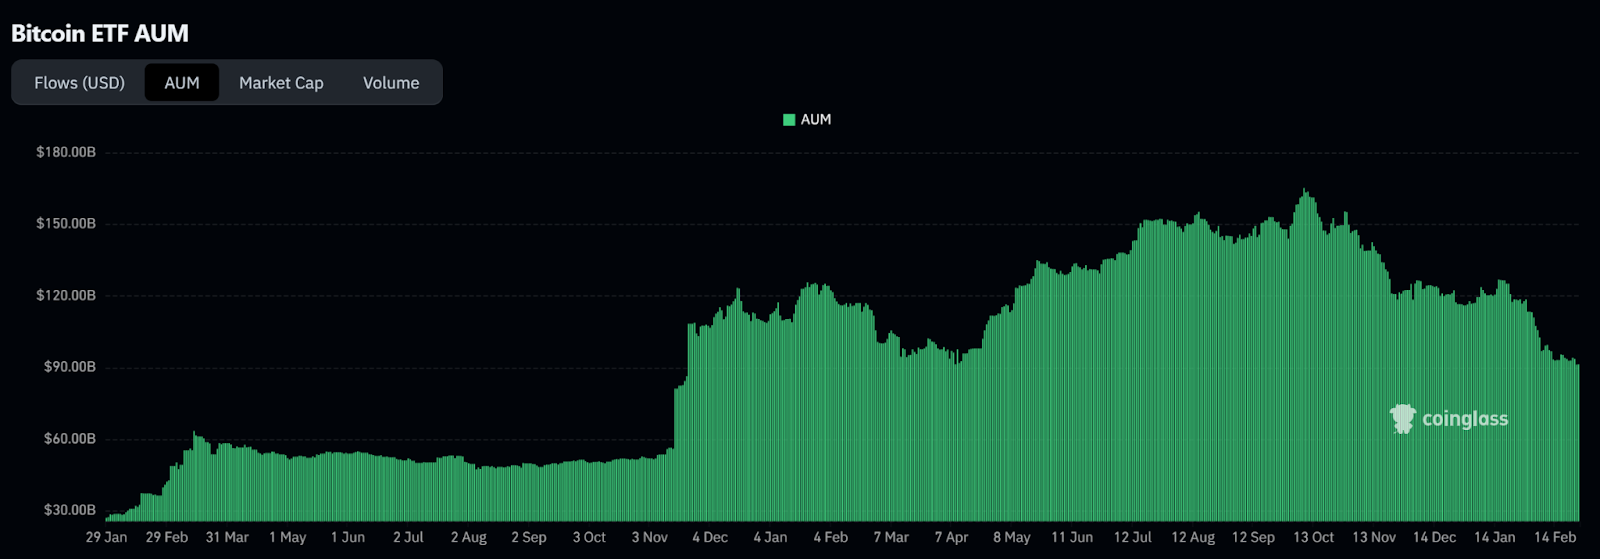
ในช่วงต้นเดือนตุลาคม 2025 ตลาดคริปโตฯ กำลังอยู่ในช่วงที่ดีที่สุดของปี ซึ่ง Bitcoin ขึ้นไปทำ All-time high ที่ $126,210 โดย Bitcoin ETF มีกระแสเงินไหลเข้าอย่างแข็งแกร่ง ในช่วง 4 วันแรกของ Q4 มี Net inflows ถึง 3,500 ล้านดอลลาร์ ทำให้ Assets Under Management (AUM) ของ Bitcoin ETF ทั้งหมดไปสู่จุดสูงสุดที่ประมาณ 160,000-170,000 ล้านดอลลาร์ ในช่วงต้นเดือนตุลาคม 2025
อย่างไรก็ตาม จุดเปลี่ยนที่สำคัญเกิดขึ้นในวันที่ 10 ตุลาคม 2025 เมื่อประธานาธิบดี Trump ประกาศภาษีศุลกากร 100% สำหรับสินค้านำเข้าจากจีน การประกาศนี้ส่งผลกระทบรุนแรงต่อตลาดการเงินทั่วโลก โดยเฉพาะตลาด Crypto ที่กลายเป็นเหตุการณ์ที่รู้จักกันในชื่อ "10/10 Crash"
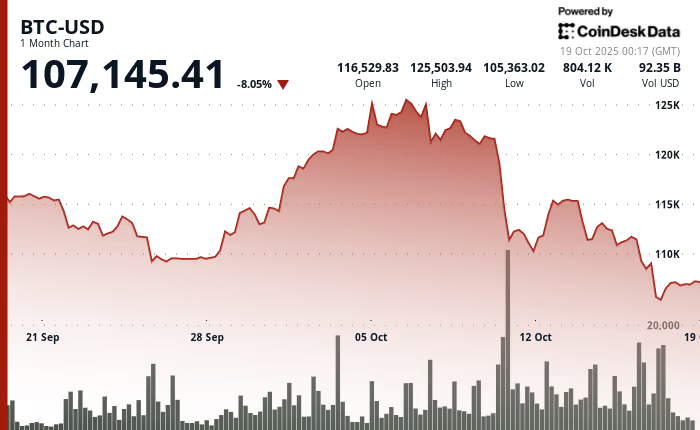
ในวันนั้น เกิด Flash crash ที่รุนแรงที่สุดในประวัติศาสตร์คริปโตฯ โดยมีการ Liquidate มากกว่า 19,000 ล้านดอลลาร์ภายใน 24 ชั่วโมง ทำให้ Bitcoin ร่วงลงมากกว่า 12-16% จากระดับ ~$122,000 ภายในไม่กี่ชั่วโมง
เหตุการณ์นี้กลายเป็นจุดเปลี่ยนที่ทำให้ตลาด Crypto เข้าสู่ Downtrend ต่อเนื่องจนถึงปัจจุบัน หลังจากวันที่ 10 ตุลาคม สถานการณ์ไม่เคยฟื้นตัวกลับมาได้จริงจัง และหลังจากเหตุการณ์นี้ Bitcoin ETF เริ่มประสบปัญหา Outflows อย่างต่อเนื่องเช่นเดียวกัน เห็นได้จากกราฟสีเขียวด้านบน
เข้าสู่ปี 2026 นอกจากตลาดจะยังไม่ฟื้นแล้ว ราคาคริปโตฯ ก็ยังลงต่ออีก โดยในช่วงต้นเดือนกุมภาพันธ์ เกิดการเทขายอย่างรุนแรง:
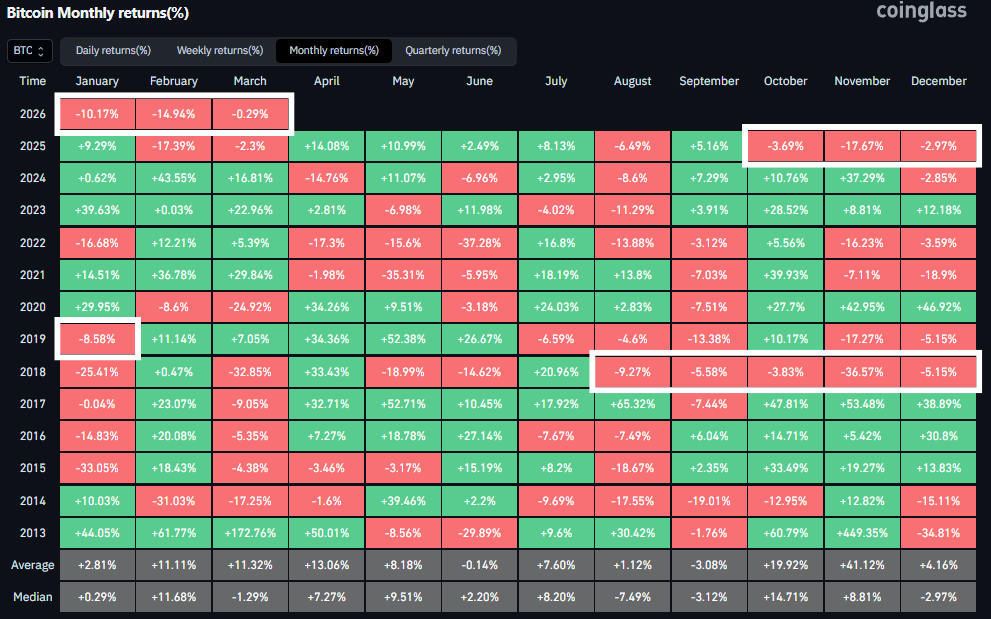
การร่วงลงอย่างต่อเนื่องสะท้อนให้เห็นถึงแรงกดดันที่สะสมมาตั้งแต่ปลายปีที่แล้วซึ่งยังไม่มีทีท่าว่าจะคลี่คลาย โดยตอนนี้ราคา Bitcoin ได้ปิดลบติดต่อกันเป็นเดือนที่ 5 โดยตอนนี้ราคา Bitcoin ได้ปิดลบติดต่อกันเป็นเดือนที่ 5 โดยถือเป็นครั้งแรกในประวัติศาสตร์ที่เดือนมกราคมและกุมภาพันธ์ปิดลบต่อเนื่องกัน นอกจากนี้ ถ้าในเดือนมีนาคมนี้ราคายังไม่สามารถฟื้นตัวและปิดลบอีกครั้ง จะถือเป็นเหตุการณ์ที่เกิดขึ้นเพียงครั้งที่ 2 เท่านั้นในตลอดอายุขัยของ Bitcoin สะท้อนถึงการปรับฐานที่รุนแรงที่สุดรอบหนึ่ง
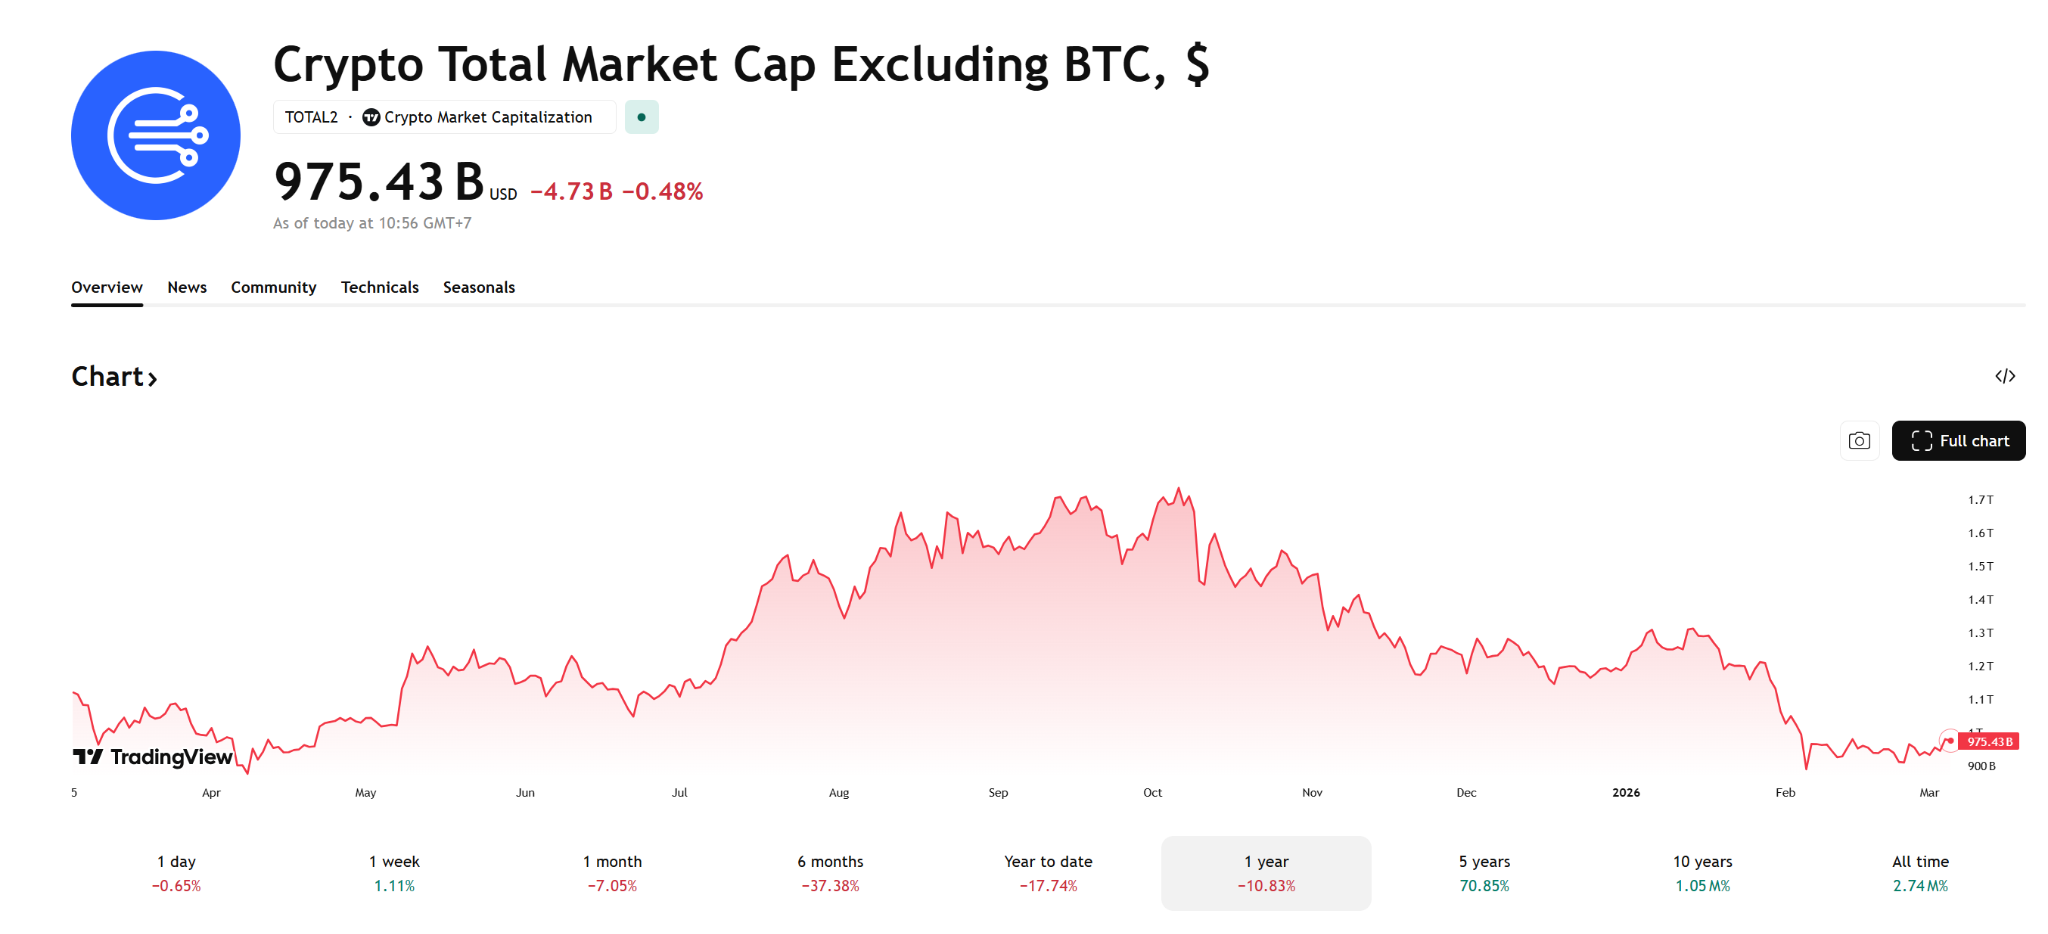
การปรับตัวลงของ Bitcoin ส่งผลกระทบไปยัง Altcoin อย่างรุนแรง โดยถ้าดูจากกราฟ TOTAL2 (Mcap ของ Altcoin ทั้งหมด) นับตั้งแต่จุดสูงสุดในเดือนตุลาคม 2025 ที่ระดับเหนือ 1.7 ล้านล้านดอลลาร์ จะเห็นได้ว่าตลาด Altcoins ได้เข้าสู่สภาวะขาลงอย่างรุนแรงและต่อเนื่อง โดยมูลค่าตลาดได้ปรับตัวลดลงกว่า 40% ภายในระยะเวลาเพียงไม่กี่เดือน และดิ่งลงอย่างหนักจนหลุดระดับทางจิตวิทยาที่ 1 ล้านล้านดอลลาร์ ในเดือนกุมภาพันธ์ 2026 ส่งผลให้สถานะปัจจุบันของมูลค่าตลาด Altcoin ตลาดอยู่ในโซนมูลค่าเหลือเพียงประมาณ 970,000 ล้านดอลลาร์
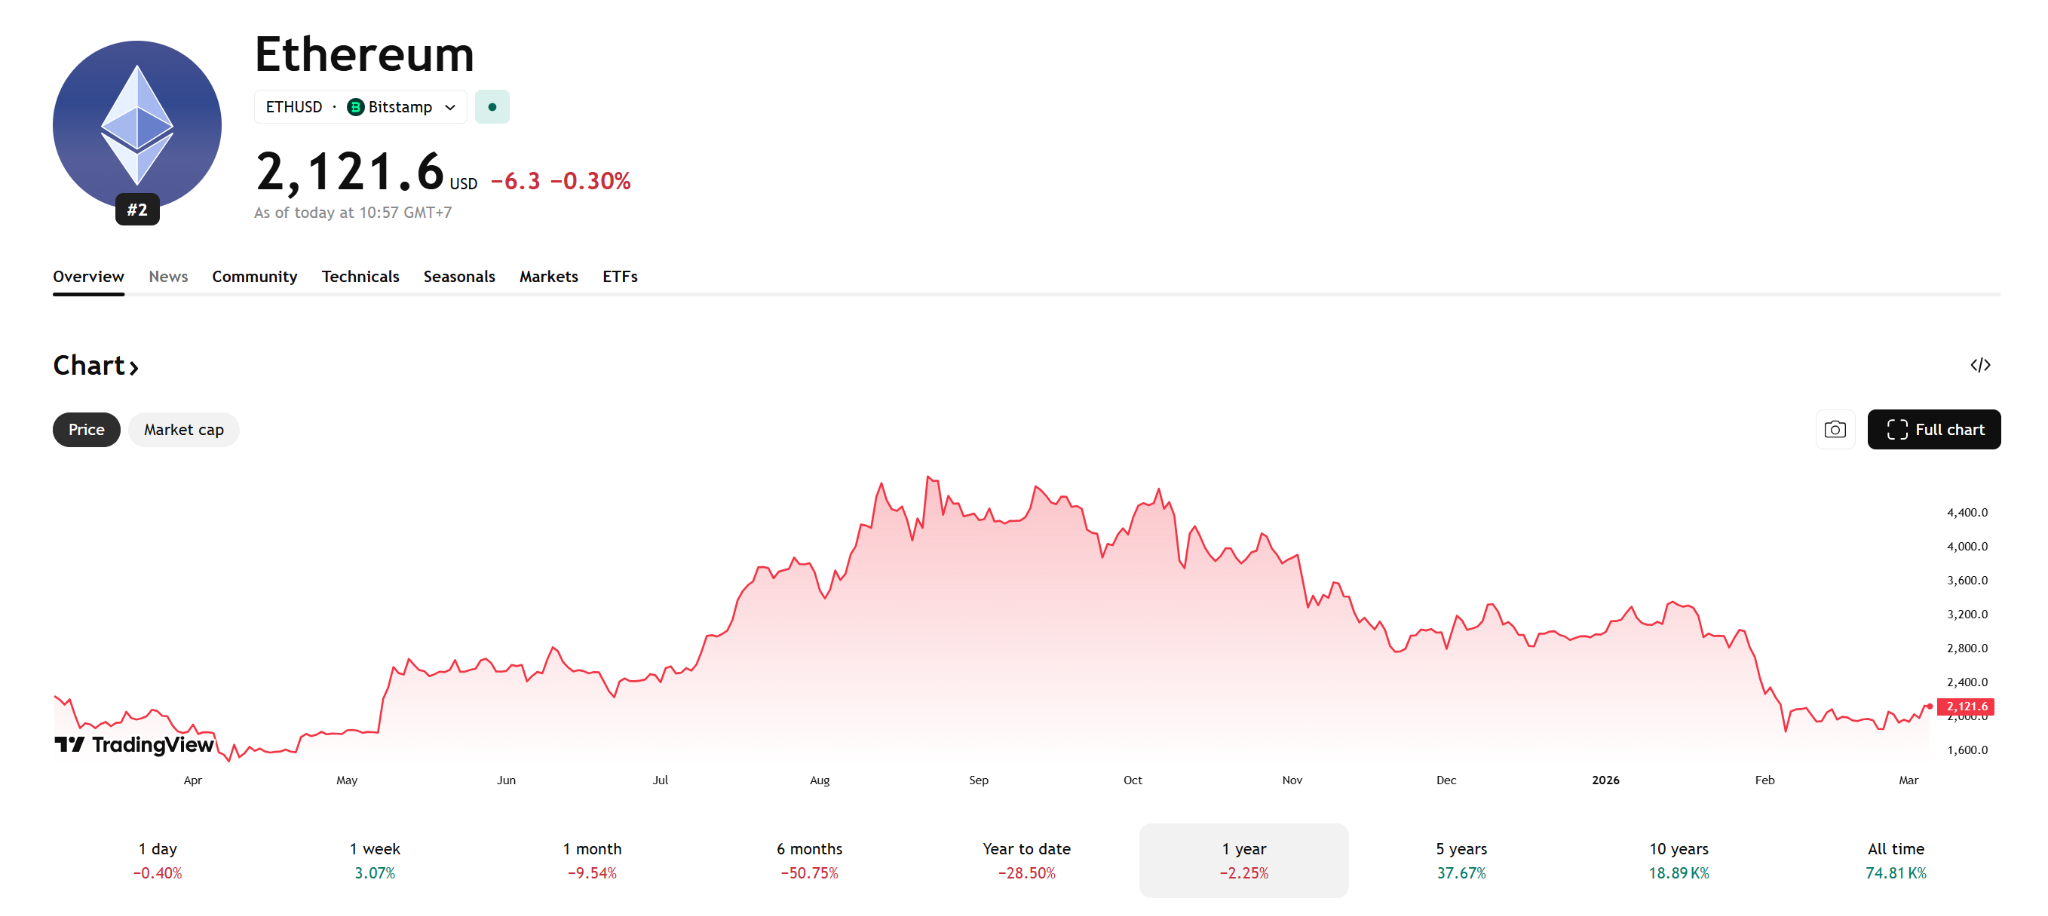
ในส่วนของ Ethereum กราฟแสดงให้เห็นว่าราคาได้เข้าสู่ช่วงขาลงหลังจากทำจุดสูงสุดเหนือระดับ $4,400 ในช่วงเดือนตุลาคม 2025 โดยปัจจุบันราคาได้ร่วงลงมาทดสอบระดับ $2,000 ซึ่งถือเป็นการปรับตัวลดลงกว่า 50% ภายในระยะเวลาเพียง 6 เดือน สภาวะตลาดในช่วงต้นปี 2026 นี้สะท้อนถึงแรงเทขายที่หนาแน่นจนราคาหลุดแนวรับสำคัญหลายระดับอย่างต่อเนื่อง สอดคล้องกับทิศทางของตลาด Altcoins โดยรวม
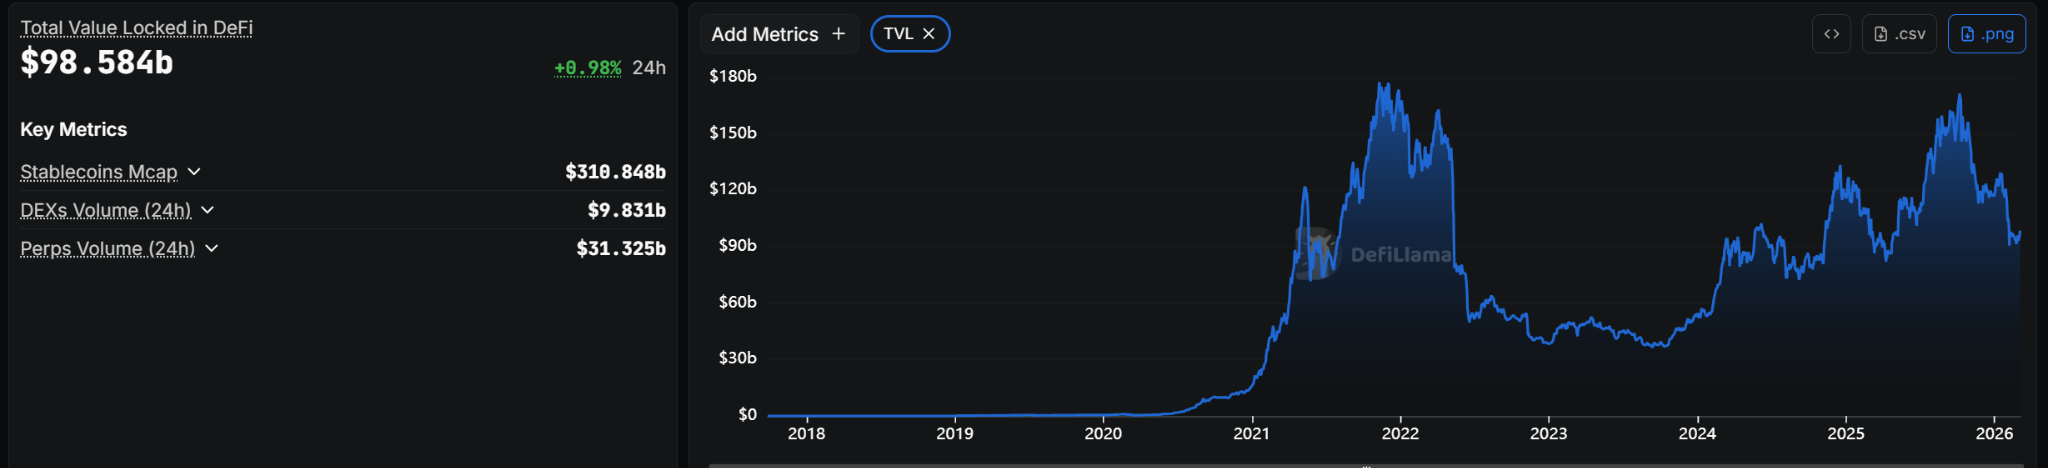
ถ้าดูสถานการณ์ของ DeFi TVL จะเห็นว่ามีความสอดคล้องไปในทิศทางเดียวกับราคา โดยหลังจากที่ TVL พุ่งขึ้นไปแตะระดับสูงสุดเกือบ 180,000 ล้านดอลลาร์ในช่วงเดือนตุลาคม 2025 ปัจจุบันมูลค่า TVL ลดลงเหลือประมาณ 98,000 ล้านดอลลาร์ ซึ่งเป็นการลดลงเกือบครึ่งหนึ่งภายในเวลาไม่กี่เดือน
สรุปคือถ้าดูจากภาพรวมของตลาดในช่วงตั้งแต่ Q4 2025 มาจนถึงในช่วง Q1 2026 จะเห็นว่าแนวโน้มการปรับฐานค่อนข้างชัดเจน ทั้งราคา Bitcoin ที่ปิดลบต่อเนื่องถึง 5 เดือน รวมถึงราคาเหรียญ Altcoin และ DeFi TVL ที่ดิ่งลงอย่างรุนแรง ทำให้เราอาจประเมินว่าตลาดได้เข้าสู่สภาวะ Bear Market อย่างเต็มตัวแล้วในเชิงเทคนิค
อย่างไรก็ตาม เพื่อเพิ่มความแม่นยำในการประเมินสถานการณ์ ในบทความนี้เราจะไปเจาะลึกสัญญาณต่าง ๆ ทั้ง On-chain, Macro และ Business Cycle อีกครั้ง เพื่อดูว่าภายใต้ความเลวร้ายนี้ จริงๆ แล้วเรากำลังอยู่ตรงจุดไหนของ Cycle กันแน่ และมีสัญญาณกลับตัวแฝงอยู่บ้างหรือไม่
ในพาร์ทต่อไปเราจะไปดูปัจจัยต่างๆ เพื่อวิเคราะห์สถานการณ์ให้ชัดเจนยิ่งขึ้น เริ่มที่ปัจจัยที่สำคัญมากๆ อย่าง Macroeconomics
ปฏิเสธไม่ได้ว่า Macro ถือเป็นปัจจัยสำคัญที่ส่งผลโดยตรงต่อคริปโตฯ อย่างมาก โดยด้านนี้ก็มีทั้งปัจจัยลบและปัจจัยบวก เช่น
อัตราดอกเบี้ยระยะสั้นของธนาคารกลางสหรัฐฯ (Federal Funds Rate) ปัจจุบันอยู่ที่ 3.5%-3.75% หลังจากที่ FOMC ประชุมเมื่อวันที่ 28 มกราคม 2026 และตัดสินใจคงอัตราไว้ เป็นครั้งแรกหลังจากลดดอกเบี้ยมา 3 ครั้งติดต่อกันในปี 2025 (กันยายน, พฤศจิกายน และธันวาคม รวม 75 basis points)
สิ่งที่ต้องจับตาคือสถานการณ์เงินเฟ้อที่ยังคงสูงกว่าเป้าหมาย 2% ซึ่งอาจส่งผลให้ Fed ไม่สามารถปรับลดอัตราดอกเบี้ยลงได้อย่างรวดเร็วในปี 2026 นอกจากนี้ การเข้ามาของประธาน Fed คนใหม่ (Kevin Warsh) ที่มีท่าทีแบบ Hawkish หมายความว่าปัจจัยบวกจากการลดดอกเบี้ยที่ตลาดสินทรัพย์เสี่ยงคาดหวัง อาจไม่เกิดขึ้นตามแผนหรือไม่ได้เป็นแรงส่งที่แข็งแกร่งอย่างที่คิด
สิ่งที่ทำให้สถานการณ์ซับซ้อนยิ่งขึ้นคือผลกระทบของ Tariffs ต่อเงินเฟ้อ เพราะนโยบายการขึ้น Tariffs จะส่งผลให้เงินเฟ้อเพิ่มขึ้นในระยะสั้น (Cost-push inflation) แต่อาจทำให้เศรษฐกิจชะลอตัวในระยะยาว ซึ่ง สถานการณ์นี้ทำให้ Fed ต้องเผชิญกับ Stagflation risk ซึ่งเป็นสถานการณ์ที่แย่ที่สุดสำหรับ สินทรัพย์เสี่ยง
อีกหนึ่งปัจจัยที่ซ้ำเติมตลาดในช่วงเดือนมกราคมและกุมภาพันธ์ 2026 คือความตึงเครียดทางการทหารที่พุ่งสูงขึ้นระหว่าง สหรัฐฯ และอิหร่าน เหตุการณ์นี้เริ่มต้นจากการปะทะกันในพื้นที่ยุทธศาสตร์สำคัญ ซึ่งส่งผลกระทบต่อตลาดคริปโตฯและสินทรัพย์เสี่ยง เพราะนักลงทุน Risk-off
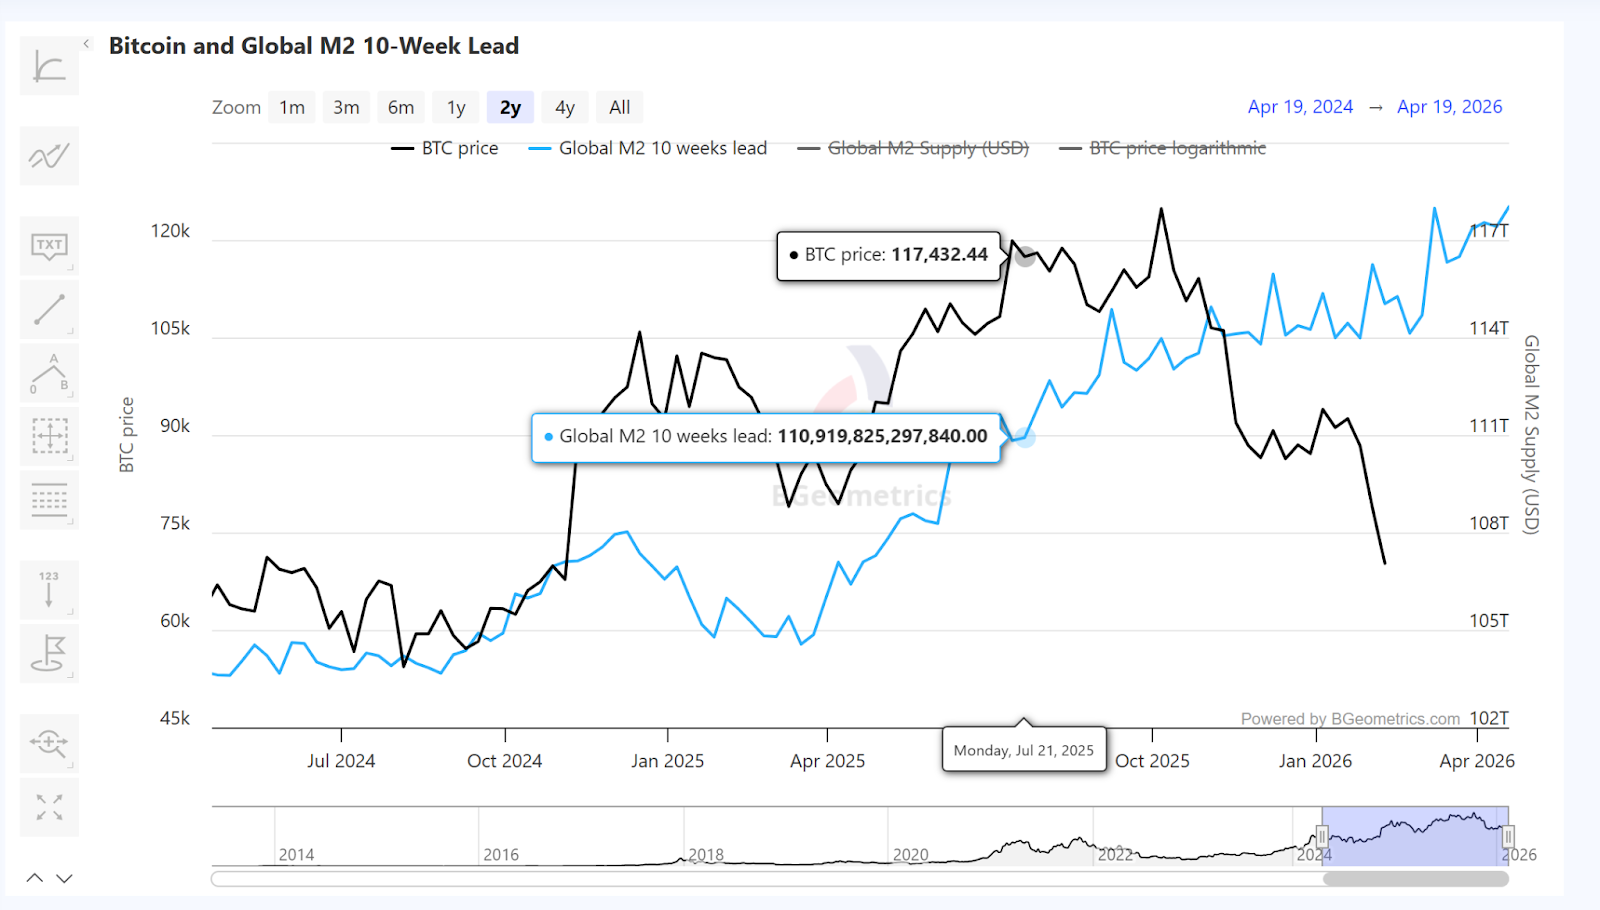
ตามทิศทางของ Global M2 โดยมี Lead Time ประมาณ 10 สัปดาห์ แต่ในช่วงที่ผ่านมาโดยเฉพาะตั้งแต่ปลายปี 2025 เป็นต้นมา เรากำลังเห็นสภาวะ Decoupling หรือการที่ราคาไม่วิ่งตาม Global M2 อย่างที่ควรจะเป็น
ซึ่งเราอาจสามารถตีความได้สองแบบ
Bullish: ถ้าเราเชื่อว่า Bitcoin vs. Global M2 Correlation ยังคงอยู่ แสดงว่า Bitcoin อาจกำลังอยู่ในช่วง Undervalued เมื่อเทียบกับสภาวะสภาพคล่อง และในที่สุดราคาก็ควรจะวิ่งตามขึ้นไป ซึ่งมุมมองนี้จะหมายถึงว่าเป็นโอกาสในการเข้าซื้อ
Bearish: Bitcoin vs. Global M2 Correlation อาจไม่มีอยู่จริงแล้ว หรืออาจจะเป็นความจริงเฉพาะช่วงเวลาใดช่วงเวลาหนึ่งเท่านั้น หรืออาจมีปัจจัยอื่น ๆ (ความกังวลด้านกฎหมาย,Macro, ตลาด Risk off, etc) ที่ทำให้ Correlation เกิดขึ้นไม่ได้
แม้ว่า Fed จะประกาศยุติการทำ QT อย่างเป็นทางการไปเมื่อวันที่ 1 ธันวาคม 2025 ซึ่งควรจะเป็นข่าวดีที่ช่วยปลดล็อกสภาพคล่องให้กับตลาด แต่สถานการณ์ในเดือนกุมภาพันธ์ 2026 กลับไม่ได้เป็นอย่างที่นักลงทุนคาดหวัง โดยมีอยู่ 3 เหตุผลหลักที่อธิบายได้ว่าทำไมสภาพคล่องถึงยังไม่กลับมา
เหตุผลแรกคือ Balance Sheet Lag ตามสถิติในอดีต เช่นในปี 2019 แม้ Fed จะประกาศหยุด QT แต่ขนาดงบดุลไม่ได้ดีดตัวกลับทันที เนื่องจากยังมีพันธบัตรบางส่วนที่ครบกำหนดไถ่ถอนตามรอบอยู่ ทำให้ในช่วงเดือนธันวาคม 2025 ถึงมกราคม 2026 สภาพคล่องในระบบยังคงอยู่ในระดับต่ำ และตลาดอาจต้องรอจนถึงช่วงกลางปี 2026 กว่าจะเห็นผลจริง
เหตุผลที่สองคือความไม่แน่นอนจาก Kevin Warsh การที่ประธาน Fed คนใหม่เข้ารับตำแหน่งพอดีกับช่วงที่ QT เพิ่งจบลง ทำให้ตลาดกังวลว่าแม้ QT จะหยุดแล้ว แต่ Fed ภายใต้การนำของเขาอาจเลือกที่จะยังไม่ทำ QE เพราะต้องการคุมเงินเฟ้อที่อาจพุ่งขึ้นจากนโยบาย Tariffs แทนที่จะรีบอัดฉีดเงินเข้าระบบ
เหตุผลที่สามคือ Trapped Liquidity แม้ Fed จะหยุดดึงเงินออกแล้ว แต่ธนาคารเองก็เลือกที่จะกักเงินสดไว้เป็นทุนสำรองมากขึ้น เพราะความผันผวนของนโยบายการค้าและความเสี่ยงด้านภูมิรัฐศาสตร์ที่ยังไม่คลี่คลาย ผลคือแม้ระดับบนจะหยุดดูดสภาพคล่องออก แต่ระดับล่างก็ไม่ยอมปล่อยออกมาเช่นกัน ทำให้ตลาดรอง (Secondary Market) ยังคงแห้งแล้งต่อไป
คำถามสำคัญที่นักลงทุนกำลังจับตาดูอย่างใกล้ชิดคือ Fed จะเปลี่ยนจากการหยุด QT ไปสู่การทำ QE เมื่อไหร่? ซึ่งเราคาดว่าการจะเกิด QE ได้นั้นอาจต้องเห็นสัญญาณเศรษฐกิจถดถอยที่รุนแรงหรือวิกฤตในตลาดพันธบัตรที่เกิดจากหนี้สหรัฐฯ และผลกระทบของสงครามการค้า ถ้าเศรษฐกิจเพียงแค่ชะลอตัวแต่เงินเฟ้อยังค้างสูง Fed อาจจะเลือกยังไม่ทำ QE ซึ่งจะเป็นสถานการณ์ที่กดดันราคาคริปโตฯต่อไป
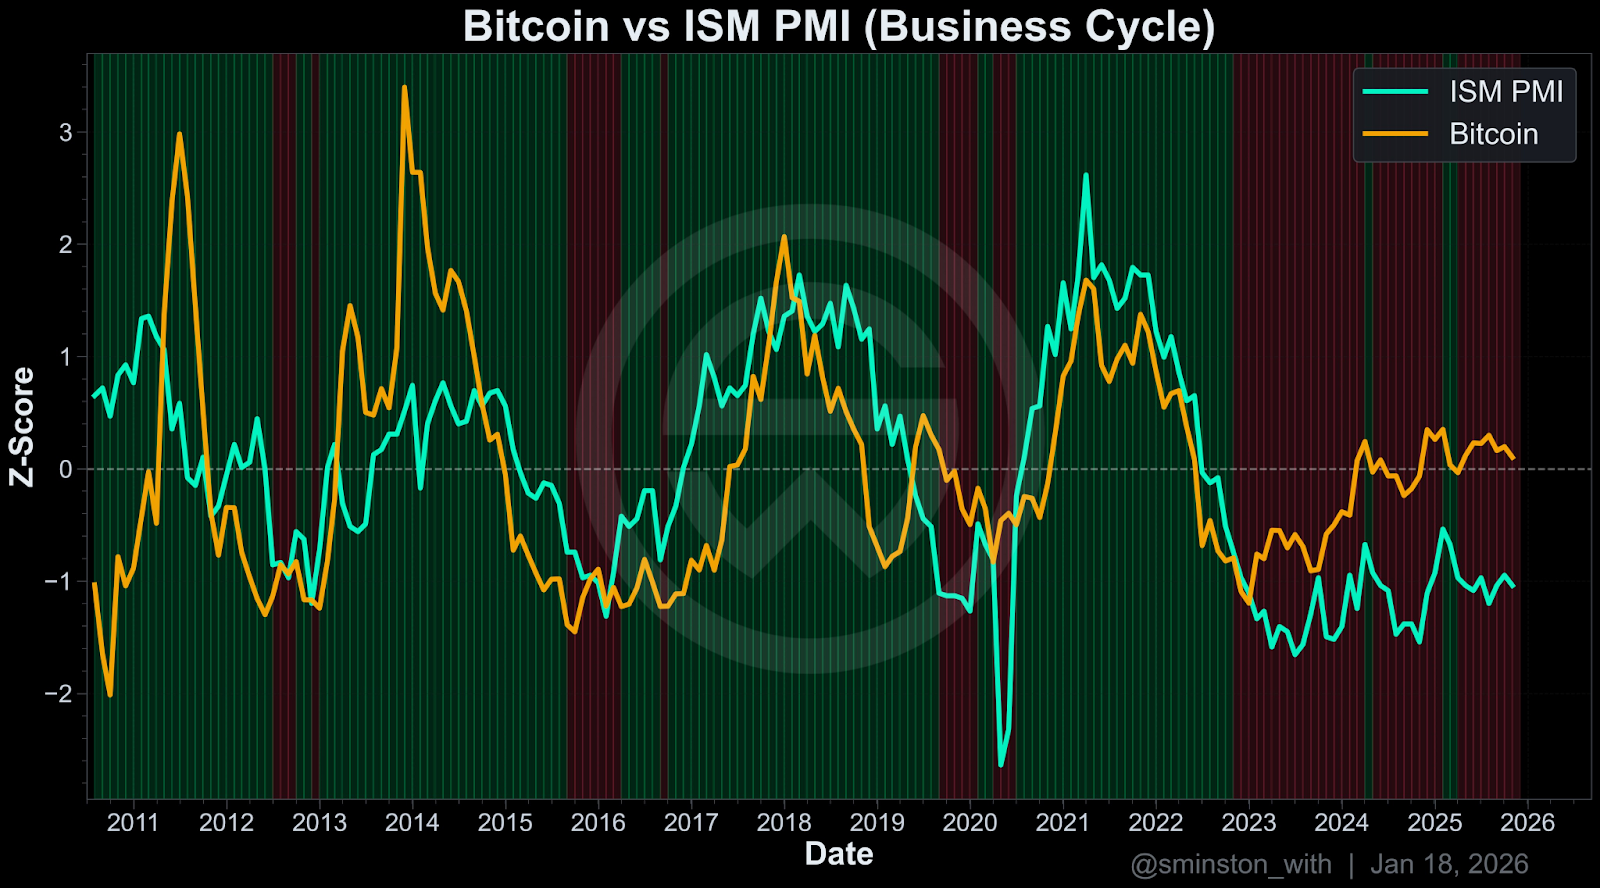
กราฟจาก Sminston With และ Plan C แสดงข้อมูลราคา Bitcoin และ ISM PMI ที่ถูก Normalize เป็น Z-score เป็นเวลา 15 ปี แถบสีเขียวและสีแดงในแนวตั้งแสดงถึงช่วงที่เศรษฐกิจขยายตัวและหดตัวตามลำดับ (โดยปกติกำหนดจาก PMI ที่อยู่เหนือหรือต่ำกว่า 50 แต่เพื่อความสะดวกในการอ่านกราฟ ใช้ค่า 0 เป็นเส้นแบ่งแทน)
ซึ่งทาง Sminston With และ Plan C ได้สรุปว่า ราคา Bitcoin นั้นสอดคล้องกับ Business Cycle ค่อนข้างมาก โดยจากกราฟจะเห็นว่า Power Law Residual ของ Bitcoin (เส้นสีส้ม) เคลื่อนไหวสอดคล้องไปกับ PMI (เส้นสีฟ้า) ผ่านหลาย Cycle แล้ว กล่าวคือ เมื่อภาคการผลิตขยายตัว Bitcoin มักมีราคาเพิ่มขึ้น ในทางกลับกันเมื่อภาคการผลิตหดตัว Bitcoin มักมีราคาต่ำลง
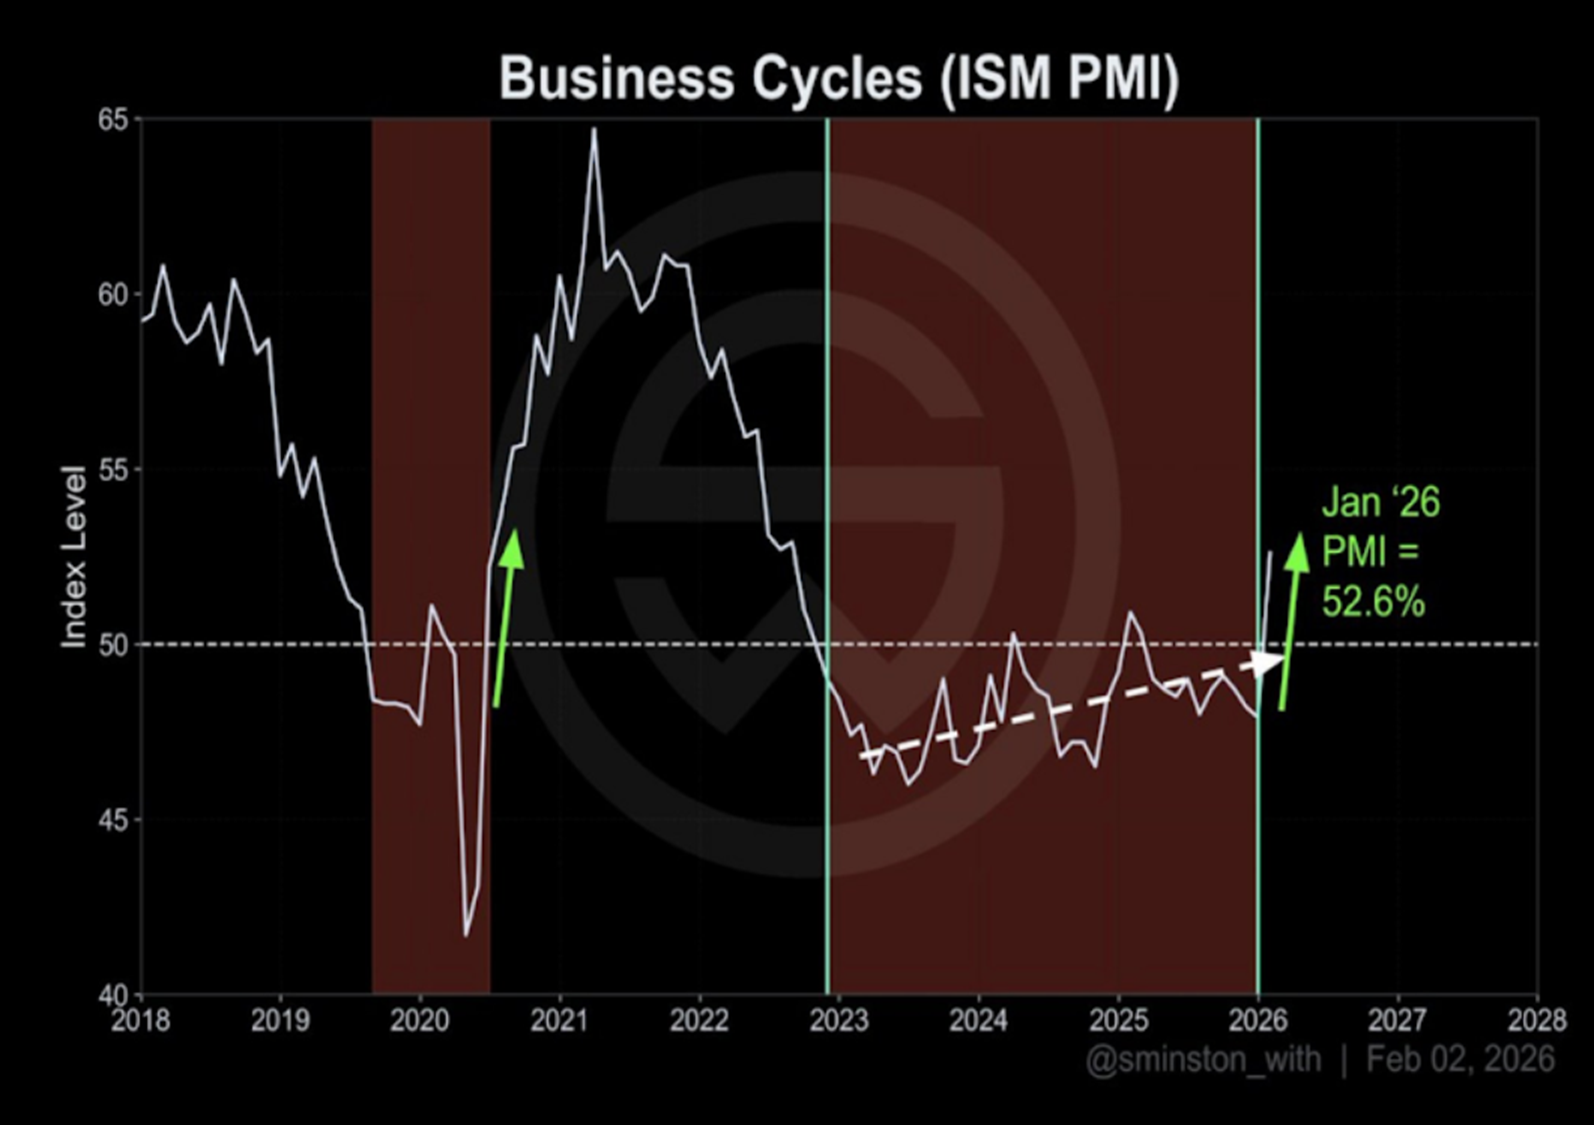
โดยในช่วงที่ผ่านมาตลอดปี 2025 ISM PMI เรียกว่าอยู่ในช่วง Business Cycle หดตัวมาโดยตลอด อย่างไรก็ตาม ตัวเลข PMI เดือนมกราคม 2026 ประกาศออกมาที่ 52.6% (สูงกว่า 50 คือขยายตัว) ซึ่งเป็นการหักหัวกลับขึ้น จึงอาจเป็นสัญญาณว่า Business Cycle ได้ผ่านจุดต่ำสุดไปแล้ว และกำลังเข้าสู่รอบใหม่ก็ได้ ซึ่งเป็นปัจจัยบวกสำหรับ Bitcoin ว่าการขึ้นขาถัดไปอาจกำลังมา ถ้าเกิดว่าเศรษฐกิจกลับตัวจากจุดต่ำสุดจริง
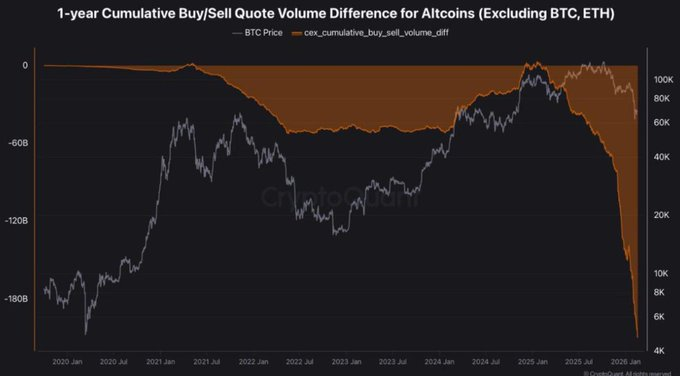
กราฟ 1-year Cumulative Buy/Sell Quote Volume Difference สำหรับ Altcoins (ไม่รวม BTC และ ETH) จาก CryptoQuant แสดงให้เห็นว่าในช่วงที่ผ่านมา แรงขายใน Altcoins สะสมลงไปถึงระดับ -180,000 ล้านดอลลาร์ ซึ่งเป็นระดับที่ไม่เคยเกิดขึ้นมาก่อนในประวัติศาสตร์ของตลาดคริปโตเลยทีเดียว
เมื่อเทียบกับ Bear market ปี 2022 ซึ่งถือว่ารุนแรงมาก ครั้งนั้น Cumulative Sell Volume ยังไม่ได้ดิ่งลงในระดับนี้ ซึ่งสะท้อนให้เห็นว่าความต้องการขาย Altcoins ในรอบปัจจุบันมีความรุนแรงและต่อเนื่องกว่าอย่างมีนัยสำคัญ
อย่างไรก็ตาม มีจุดที่น่าสังเกตคือแม้แรงขายจะหนักมากขนาดนี้ แต่ Market cap ของ Altcoins โดยรวมยังไม่ได้พังทลายลงสู่ระดับที่ต่ำกว่า Bear market ปี 2022 มากนัก ซึ่งอาจตีความได้ว่ายังมีแรงซื้อที่คอย Absorb แรงขายอยู่บ้าง
ทั้งนี้ก็ไม่ได้การันตีว่าตลาดจะกลับตัวในเร็วๆ นี้ เพราะแรงขายในลักษณะนี้อาจเกิดต่อไปได้อีกถ้าปัจจัย Macro ยังไม่เปลี่ยน แต่ในเชิงประวัติศาสตร์ ระดับ Capitulation ที่รุนแรงผิดปกติมักเป็นสัญญาณที่นักลงทุนระยะยาวจับตาดูในฐานะจุดที่ Risk/Reward เริ่มเอียงไปในทิศทางที่น่าสนใจขึ้น
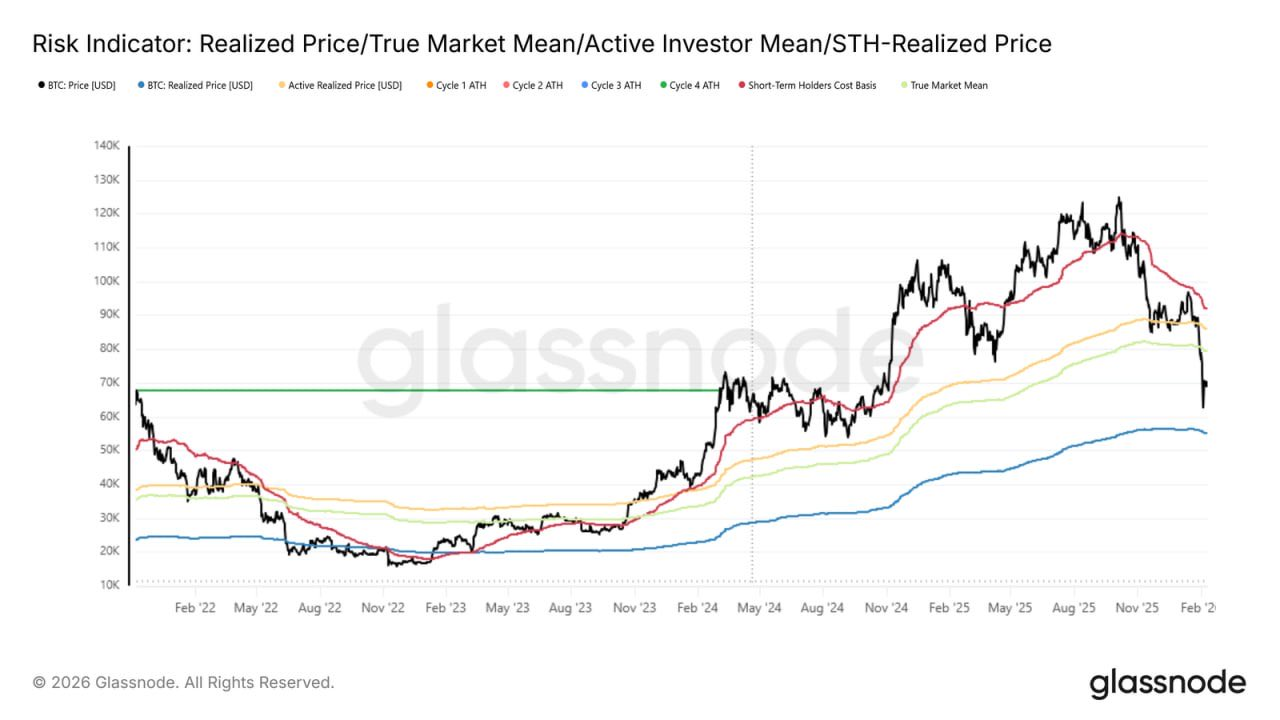
True Market Mean เป็น Onchain Indicator ที่ใช้สำหรับประเมินต้นทุนเฉลี่ยในการซื้อ Bitcoin ของ Active Participant เป็นหลัก โดยเน้นไปที่ Bitcoin ที่มีการซื้อขายและหมุนเวียนอยู่ในตลาดรองจริงๆ ด้วยการตัด Bitcoin ที่ผลิตจาก Miner ออกไป ซึ่งช่วยในการระบุว่าตลาดอยู่ในสภาวะ Overvalue หรือ Undervalue โดยหลักการประเมินคือถ้าราคาหลุดต่ำว่า True Market Mean มักหมายถึงว่าเราเข้าสู่ตลาดหมีแล้ว
จากข้อมูลล่าสุดในเดือนกุมภาพันธ์ 2026 ราคา Bitcoin ได้หลุดแนวรับสำคัญอย่าง True Market Mean ลงมาแล้ว ซึ่งเส้นนี้อยู่ที่ระดับประมาณ $79,000 โดยมีเป้าหมายถัดไปคือเส้น Realized Price (สีน้ำเงิน) ซึ่งเปรียบเสมือนแนวรับสุดท้ายซึ่งอยู่ที่ระดับ $54,900 ซึ่งเป็นเส้น Realized Price ในปัจจุบัน
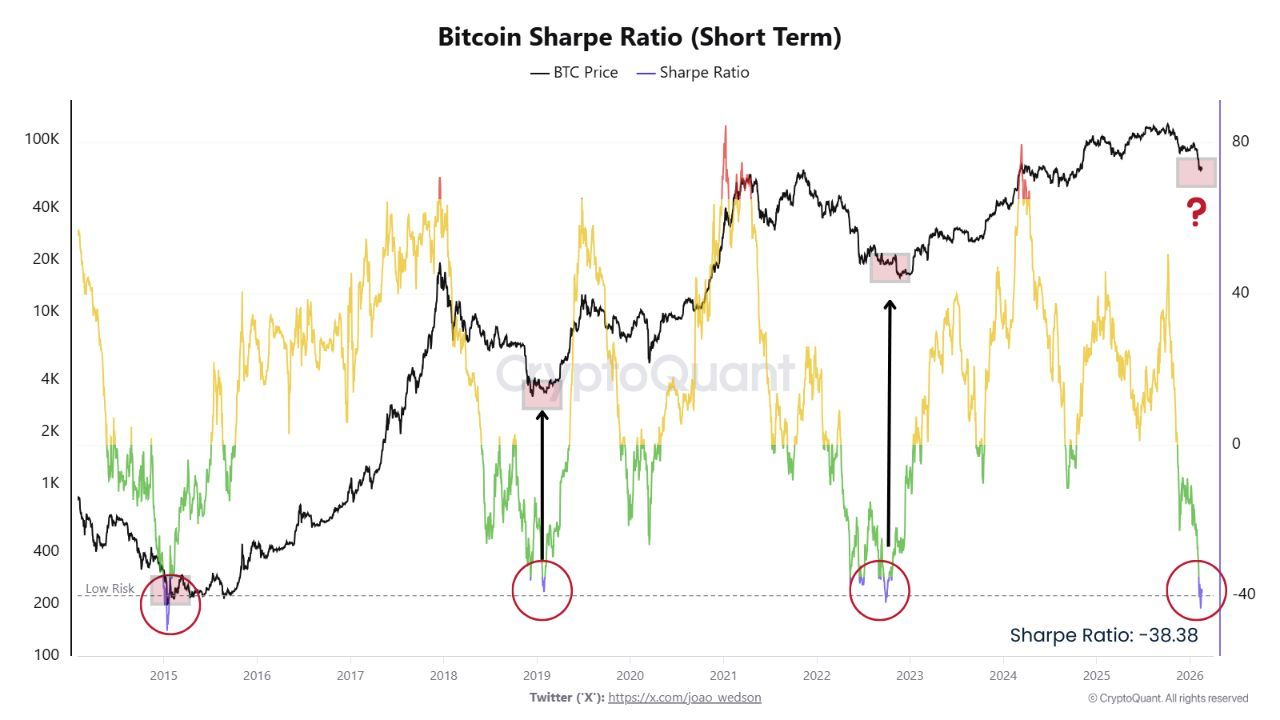
ถ้าดูจาก Short-term Sharpe Ratio ของ Bitcoin ซึ่งเป็นตัววัดผลตอบแทนเมื่อเทียบกับความเสี่ยง (Risk-adjusted returns) เมื่อค่านี้ติดลบอย่างรุนแรง หมายความว่าสินทรัพย์นั้นกำลังสร้างความเสียหาย (Pain) สูงมากเมื่อเทียบกับความผันผวน นำไปสู่สภาวะ Capitulation หรือการยอมแพ้ของนักลงทุน โดยค่านี้ได้ดิ่งลงไปแตะระดับประมาณ -38 ซึ่งเป็นระดับเดียวกับตลาดหมีในช่วงปี 2015, 2019 และปลายปี 2022 ซึ่งทุกครั้งล้วนเป็นจุดต่ำสุดของรอบ (Cycle Bottoms)
โดยเราอาจมองว่าเป็นสัญญาณการสิ้นสุดแรงขาย หรือแรงขายเริ่มหมดแรง และมักไม่ใช่จุดเริ่มต้นของการลงของราคาหนักๆครั้งใหม่ โดยประวัติศาสตร์บอกเราว่าหลังจากเกิดสัญญาณนี้ มักจะตามมาด้วยการฟื้นตัวที่รุนแรง อธิบายง่ายๆว่าจุดนี้มักเป็นจุดที่ีความเสี่ยงขาลงจำกัดแล้ว
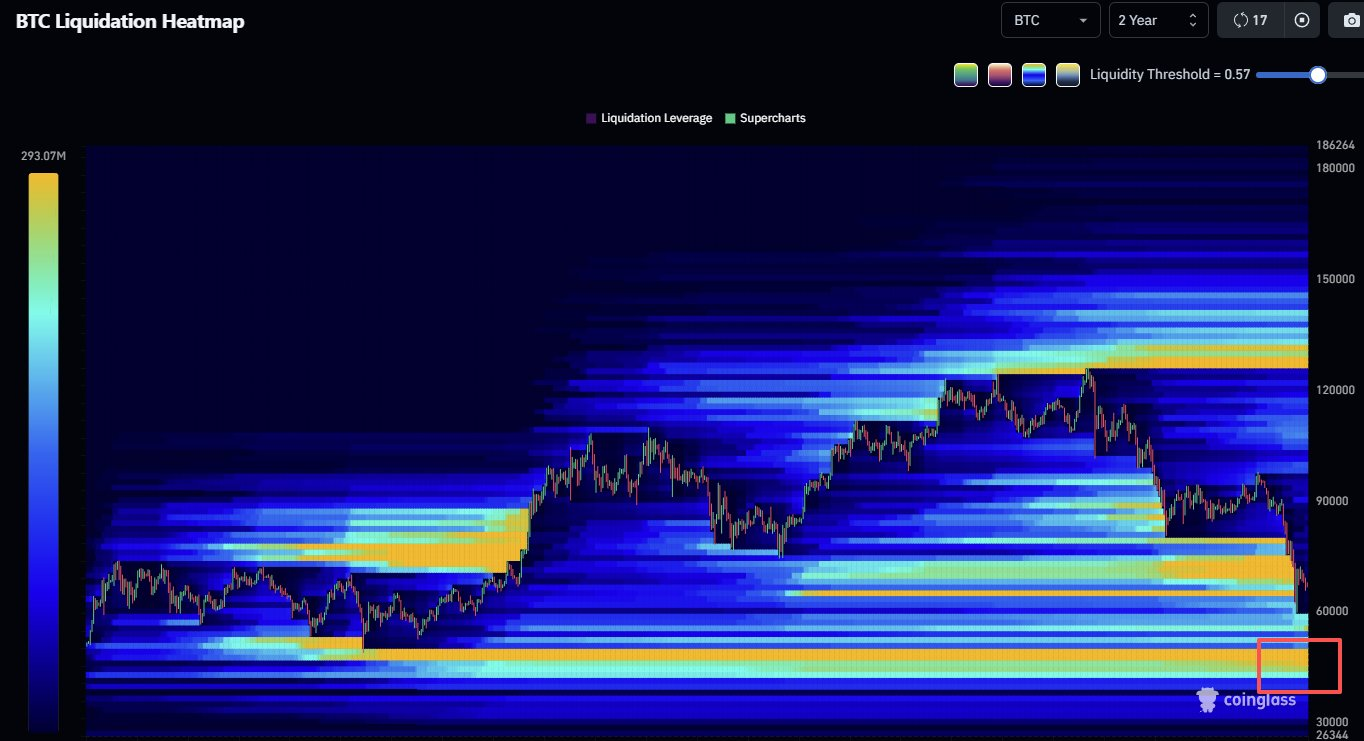
ถ้าจะดูอีกอย่างว่าราคาจะลงไปถึงเท่าไหร่ได้ เราอาจดูจาก BTC Liquidation Heatmap ระยะเวลา 2 ปี ของ Coinglass จะเห็นว่าบริเวณที่มีการสะสม ของ Liquidation ที่หนาแน่นที่สุดในรอบ 2 ปีนั้น กองรวมกันอยู่ที่ระดับ 40,000 - 50,000 ดอลลาร์ ซึ่งดูจากแถบสีเหลืองสดในกราฟ
ถ้าตลาดเกิดการปรับฐานรุนแรง ราคาในปัจจุบันอาจจะถูกดึงดูดลงไปกวาดสภาพคล่อง (Liquidation Hunt) ในช่วงราคานี้เพื่อเคลียร์สถานะฝั่ง Long ที่สะสมมานาน สัญญาณ Onchain ทั้งหมดที่เราเห็นบอกว่าตลาดกำลังอยู่ในช่วงที่เจ็บปวด แต่คำถามคือสถานการณ์ตอนนี้หนักแค่ไหนเมื่อเทียบกับรอบที่ผ่านมา และตลาดยังลงอีกได้แค่ไหน? เพื่อตอบคำถามนี้ เราต้องย้อนดูว่าตลาดหมีในอดีตในพาร์ทถัดไป
ในพาร์ทนี้เราจะไปดูตลาดหมีที่เกิดขึ้นในอดีตในช่วงปี 2014, 2018, 2022 ตามทฤษฎี 4-Year Cycle เพื่อคาดการณ์ความเป็นไปได้ของตลาดหมีในปี 2026
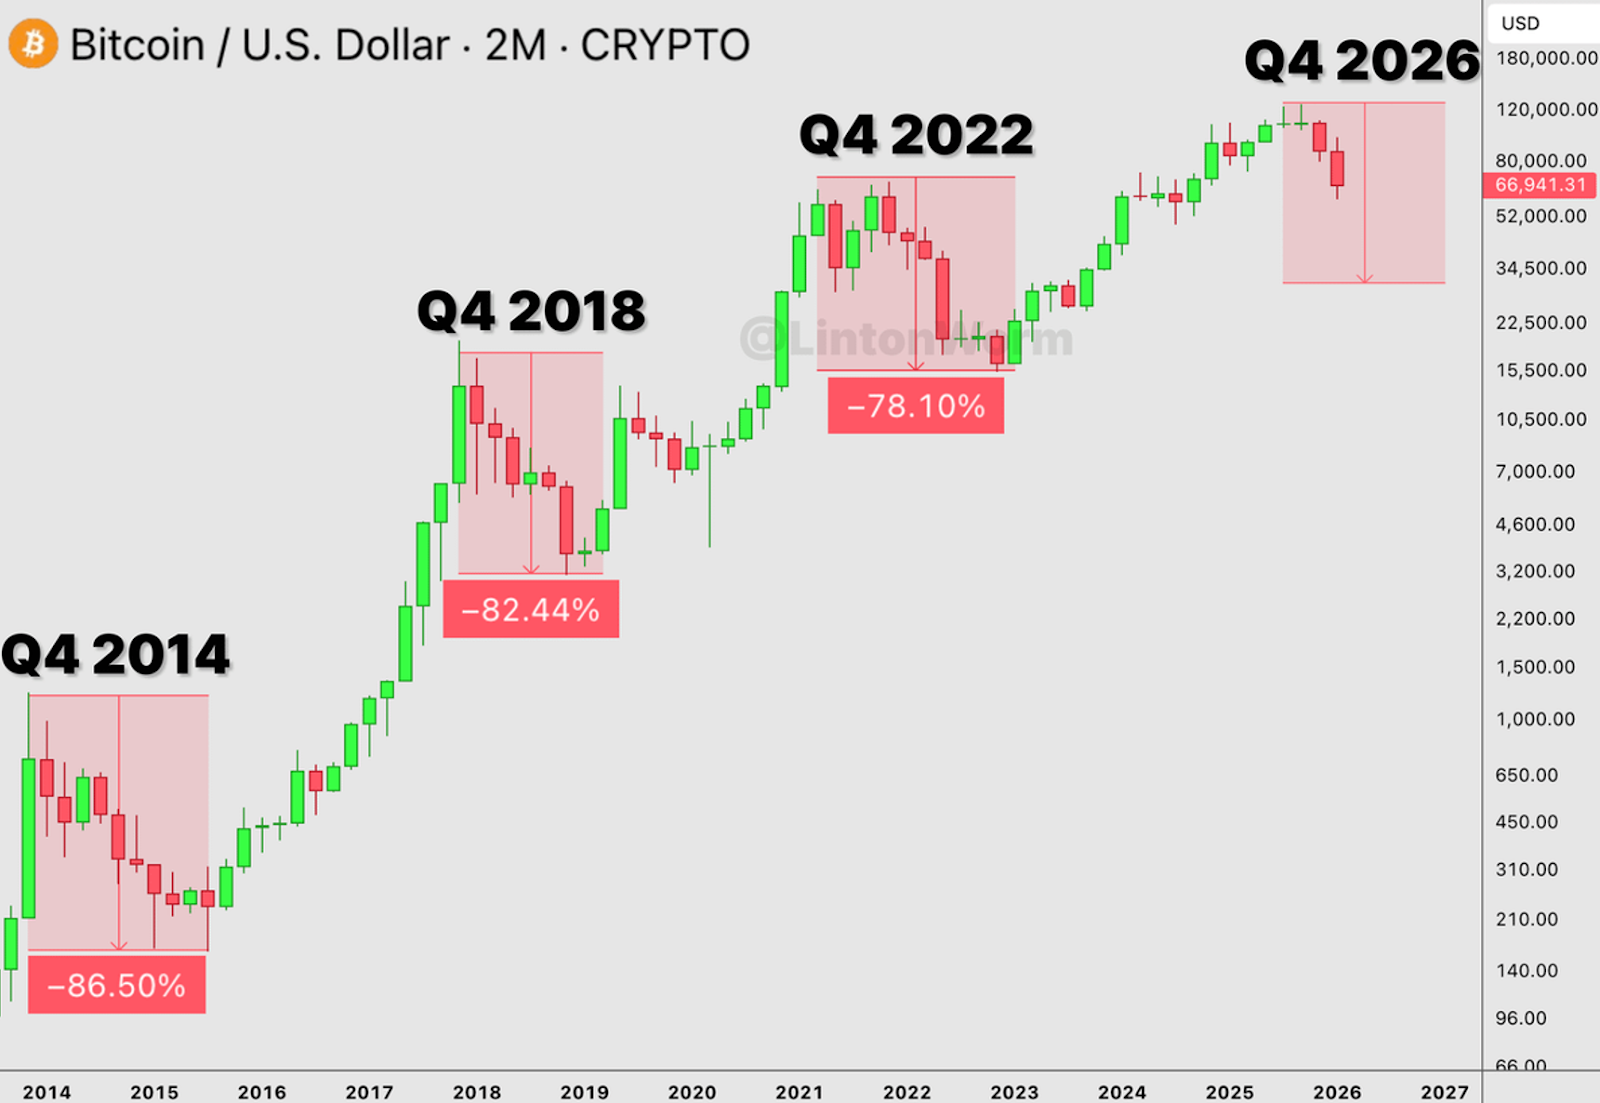
กราฟแสดงให้เห็นว่าในทุกๆ รอบ 4 ปี Bitcoin มักจะเจอกับการปรับฐานครั้งใหญ่หลังจากทำจุดสูงสุด และถ้าอิงตามทฤษฎี 4-Year Cycle ก็เท่ากับว่าเรากำลังอยู่ในตลาดหมีเรียบร้อยแล้ว โดยจุดสูงสุดของราคา Bitcoin ในเดือนตุลาคม 2025 ถือว่าสอดคล้องตามระยะเวลาของ 4-Year Cycle พอดี
โดยมีตัวเลขในช่วงตลาดหมีในอดีตที่น่าสนใจดังนี้:
ข้อสังเกตคือเปอร์เซ็นต์การร่วงลงมีแนวโน้มน้อยลงเรื่อยๆในทุกรอบ ตามขนาดของ Market Cap ที่ใหญ่ขึ้นของ Bitcoin ซึ่งถ้าส่วนต่างการร่วงของราคาน้อยลงเรื่อยๆแบบ Linear ในตลาดหมีปี 2026 นั้นเป็นไปได้ว่า Bitcoin อาจปรับฐานจาก ATH ได้ราว 65-70% ซึ่งหมายความว่าราคาอาจลงไปได้ถึง $37,000-$44,000 โดยถ้าอิงตาม Timeline ในอดีตคาดว่าจะลงไปถึงจุดต่ำสุดในช่วง Q4 2026
2013-2015: Mt. Gox Collapse - ปัจจัยหลักมากจากแพลตฟอร์มเทรด Bitcoin ที่ใหญ่ที่สุดในโลก (70% ของ Trading volume) ถูกแฮ็กสูญหาย 850,000 BTC และประกาศล้มละลายในกุมภาพันธ์ 2014 ประกอบกับจีนเริ่มกดดัน Crypto exchanges
2017-2018: ICO Bubble Burst - ปัจจัยหลักมาจาก ICO หลายพันโปรเจกต์ล้มหรือโกงเงินนักลงทุน ประกอบกับหน่วยงานกำกับดูแลทั่วโลกเริ่มเข้มงวด (SEC จับตา ICOs, จีนและเกาหลีใต้แบนการเทรด)
2021-2022: Institutional Failures Cascade - เริ่มจากการล่มสลายของ Luna/UST ในพฤษภาคม 2022 ที่ทำลายมูลค่า $40,000 ล้าน นำไปสู่การล้มละลายแบบ Domino effect ของ Three Arrows Capital, Celsius, Voyager, BlockFi และสุดท้ายคือ FTX ที่ล้มละลายในพฤศจิกายน 2022 สูญหายกว่า $8,000 ล้าน ประกอบกับ Fed เริ่มขึ้นดอกเบี้ยอย่างรุนแรง
2025-2026: Macro-Driven Deleveraging & Narrative Collapse - คาดว่าปัจจัยหลักมาจาก Liquidation ครั้งใหญ่ในวันที่ 10 ตุลาคม 2025 ประกอบกับการแต่งตั้ง Kevin Warsh ที่สร้างความกังวลเรื่องดอกเบี้ย, และความล้มเหลวของ Narrative ที่นโยบายของ Trump จะช่วยผลักดันตลาดคริปโต
เมื่อวิเคราะห์โครงสร้างของสาเหตุและกลไกของการปรับตัวลงของตลาดรอบนี้ เราจะเห็นว่ารอบนี้มีทั้งจุดที่ดีกว่าและอันตรายกว่าตลาดหมีในรอบก่อนๆ โดยเราจะเปรียบเทียบกับรอบที่ใกล้ตัวที่สุดคือ รอบปี 2022
Bear market ปี 2022 เต็มไปด้วยการล้มละลายแบบ Cascade ที่ส่งผลต่อกัน เริ่มจาก Luna/UST ก่อนจะลากให้ Three Arrows Capital, Celsius, Voyager และ BlockFi ล้มตามกัน และปิดท้ายด้วยการล่มสลายของ FTX ซึ่งเป็นการทำลายความเชื่อใจของนักลงทุนในวงกว้างอย่างรุนแรง
รอบนี้ยังไม่มีเหตุการณ์ในลักษณะนั้น Exchange ใหญ่ๆ ยังทำงานปกติ ไม่มีการล้มละลายของ Custodian หรือ Lending platform ระดับใหญ่ และสภาพคล่องในตลาดยังไม่ได้ถูกทำลายจากการโกงหรือความล้มเหลวเชิงโครงสร้างของโปรเจกต์ใดโปรเจกต์หนึ่ง
ในปี 2022 ความไม่ชัดเจนด้านกฎหมายเป็นหนึ่งในปัจจัยกดดันตลาดตลอดเวลา แต่เข้าสู่ปี 2026 ทิศทางกฎหมายในสหรัฐฯ เริ่มชัดขึ้นอย่างมีนัยสำคัญ Bitcoin ETF ได้รับการอนุมัติและมีสถาบันใหญ่เข้ามาถือครองแล้ว ซึ่งหมายความว่าฐานนักลงทุนของ Bitcoin ในรอบนี้มีความหลากหลายและมั่นคงกว่าเดิม
Long-term holders ในรอบนี้ยังไม่ได้ Capitulate ในระดับเดียวกับปี 2022 ซึ่งอาจสะท้อนได้ว่าผู้ที่ถือ BTC ในรอบนี้มี Cost basis และ Conviction ที่แข็งแกร่งกว่า ต่างจากปี 2022 ที่มีการล้มละลายของสถาบันบังคับให้เกิด Forced selling จำนวนมาก
Bear market ปี 2022 มีปัจจัยหลักมาจากความล้มเหลวของโปรเจกต์และสถาบันในวงการคริปโตเอง ทำให้เมื่อปัญหาเหล่านั้นถูกกำจัดออกไปแล้ว ตลาดก็สามารถฟื้นตัวได้
แต่รอบนี้สาเหตุหลักมาจากปัจจัยภายนอก ไม่ว่าจะเป็นนโยบาย Tariffs ของสหรัฐฯ ความตึงเครียดทางภูมิรัฐศาสตร์ หรือท่าทีของ Fed ภายใต้ Kevin Warsh ปัจจัยเหล่านี้สามารถเปลี่ยนแปลงได้ตลอดเวลาตามการตัดสินใจทางการเมือง และไม่มีกลไกในตลาดคริปโตที่จะแก้ไขได้จากภายใน
ในปี 2022 แม้ Fed จะขึ้นดอกเบี้ยแรง แต่ทิศทางก็ยังค่อนข้างชัดเจนว่าเมื่อเงินเฟ้อลด ดอกเบี้ยก็จะลด และสภาพคล่องก็จะกลับมา แต่รอบนี้ถ้าเกิด Stagflation จริง คือเศรษฐกิจชะลอตัวพร้อมกับเงินเฟ้อที่ยังสูง Fed จะอยู่ในสถานะกลืนไม่เข้าคายไม่ออก ลดดอกเบี้ยก็กลัวเงินเฟ้อพุ่ง ไม่ลดก็ทำให้เศรษฐกิจแย่ลง สถานการณ์นี้ไม่มี Playbook ที่ชัดเจน และเป็นสิ่งที่ตลาดสินทรัพย์เสี่ยงรับมือได้ยากที่สุด
ในรอบก่อน ไม่มีบริษัทมหาชนที่ถือ Bitcoin ในระดับหลายหมื่นล้านดอลลาร์แบบที่ Digital Asset Treasury Companies ทำอยู่ในปัจจุบัน การที่บริษัทเหล่านี้มี Unrealized Loss สะสมอยู่ และยังมีภาระหนี้ที่ต้องบริหาร หมายความว่าถ้าราคา Bitcoin ลงต่อเนื่อง อาจเกิดแรงขายที่มาจาก Forced selling ของบริษัทจดทะเบียนที่ถูกกดดันจาก Shareholder และ Creditor ซึ่งเป็นกลไกที่ตลาดยังไม่เคยต้องรับมือมาก่อน
อย่างเช่นตอนนี้ Strategy ถือ BTC อยู่ 717,722 เหรียญ มูลค่ารวม ~$54.56 billion โดยมี Average Cost Basis อยู่ที่ ~$76,020 ต่อเหรียญ (ข้อมูล ณ วันที่ 23 กุมภาพันธ์ 2026) ซึ่งหมายความว่าที่ราคา Bitcoin ปัจจุบันแถวๆ $65,000-$67,000 Strategy กำลังมี Unrealized Loss อยู่กว่า 10% แม้ตอนนี้ยังไม่ถึงจุดวิกฤต เพราะโครงสร้างหนี้ส่วนใหญ่เป็น Convertible Notes ที่ครบกำหนดในปี 2027-2028 และ Michael Saylor ก็ยังแสดงท่าทีถือต่อไม่ขายอย่างชัดเจน แต่ถ้าราคา Bitcoin ลงต่อเนื่อง อาจทำให้สถานการณ์เปลี่ยนได้เร็วกว่าที่คิดได้เช่นกัน
นอกจาก Strategy แล้ว ยังมีบริษัทอื่นอีกหลายสิบแห่งที่ Copy โมเดลนี้ในช่วงขาขึ้น บางแห่งถือ Ethereum และ Altcoin อื่นๆ ด้วย ซึ่งถ้าเกิด Worst Case ขึ้นจริง แรงขายที่กระจายอยู่ในหลายบริษัทพร้อมกันอาจสร้าง Cascading Effect ที่ตลาดรับมือได้ยากกว่าการล้มละลายของสถาบันเดียวเสียอีก
อีกความแตกต่างที่น่ากังวลของ Cycle นี้ คือบทบาทของสถาบันที่เข้ามามีผลต่อตลาดคริปโตฯมากขึ้น ทั้งในด้านบวกและด้านลบ อย่างเช่นล่าสุดที่มีประเด็นเกี่ยวกับ Jane Street ซึ่งเป็นทั้งผู้คุมสภาพคล่องและ Authorized Participant ของกองทุน ETF ทุก 11 กองทุน โดยถูกฟ้องร้องในคดีใช้ข้อมูลวงในเพื่อชิงเทขายก่อนตลาดในช่วงการล่มสลายของ Terra Luna ในปี 2022 นอกจากนี้ยังมีข้อกล่าวหาเรื่องพฤติกรรมการเทขาย (10 AM Dump) ในช่วงเปิดตลาดสหรัฐฯ ซึ่ง Jane Street ปฏิเสธข้อกล่าวหาทั้งหมด
อย่างไรก็ตาม ไม่ว่าข้อกล่าวหาเหล่านี้จะเป็นความจริงหรือไม่ สิ่งที่ตลาดกำลังเผชิญอยู่จริงคือความไม่ไว้วางใจที่เพิ่มขึ้น เมื่อ Smart Money ที่ทำหน้าที่ดูแลสภาพคล่องของ ETF ถูกตั้งคำถามถึงความโปร่งใส ก็เป็นเรื่องยากที่นักลงทุนทั่วไปจะมั่นใจได้ว่า Price Action ที่เห็นสะท้อนอุปสงค์และอุปทานจริงๆ หรือเป็นเพียงผลจากโครงสร้าง ETF Mechanism ที่ยังมีจุดบอดอยู่
ในช่วงต้นปี 2026 เรียกได้ว่าตลาดมี Sentiment ที่ค่อนข้างซบเซาครั้งหนึ่งในประวัติศาสตร์คริปโตฯ โดยในปี 2024-2025 หลังจากที่ Trump เข้ารับตำแหน่ง Sentiment ส่วนใหญ่ถูกขับเคลื่อนด้วยความคาดหวังว่านโยบายของ Trump จะเป็นผลบวกต่อคริปโตฯ แต่เมื่อเข้าสู่ปี 2026 Sentiment ได้กลายเป็นความผิดหวัง โดยส่วนหนึ่งคาดว่านักลงทุนเริ่มตระหนักว่านโยบาย Tariffs ไม่ได้ส่งผลดีต่อสินทรัพย์เสี่ยง เพราะเป็นสิ่งกระตุ้นเงินเฟ้อและอาจบีบให้ Fed ต้องคงดอกเบี้ยสูง (Hawkish)
นอกจากนี้ความเชื่อที่ว่า Bitcoin จะเป็น Safe Haven ในช่วงสงครามการค้าถูกท้าทายอย่างหนัก เมื่อราคาดันร่วงตามตลาดหุ้น ทำให้เกิดสภาวะ Narrative Crisis หรือการสูญเสียที่ยึดเหนี่ยวทางความคิดของนักลงทุน ประกอบกับการที่เราเห็นสัญญาณการปรับพอร์ต (Rebalancing) ครั้งใหญ่ ซึ่งถึงแม้สถาบันไม่ได้ขาย Bitcoin ทิ้งทั้งหมด แต่เลือกที่จะลดสัดส่วน (De-risking) เพื่อถือเงินสดรอความชัดเจนจากประธาน Fed คนใหม่ (Kevin Warsh)
ในฝั่งของนักลงทุนรายย่อย Sentiment เข้าสู่สภาวะ Apathy โดย Google Search Trends ในการค้นหาที่เกี่ยวข้องกับ "Bitcoin" และ "Crypto" ในช่วงเดือนกุมภาพันธ์ 2026 ลดลงสู่ระดับต่ำสุดในรอบ 18 เดือน สะท้อนว่ารายย่อยเริ่มถอดใจและออกจากตลาดไป
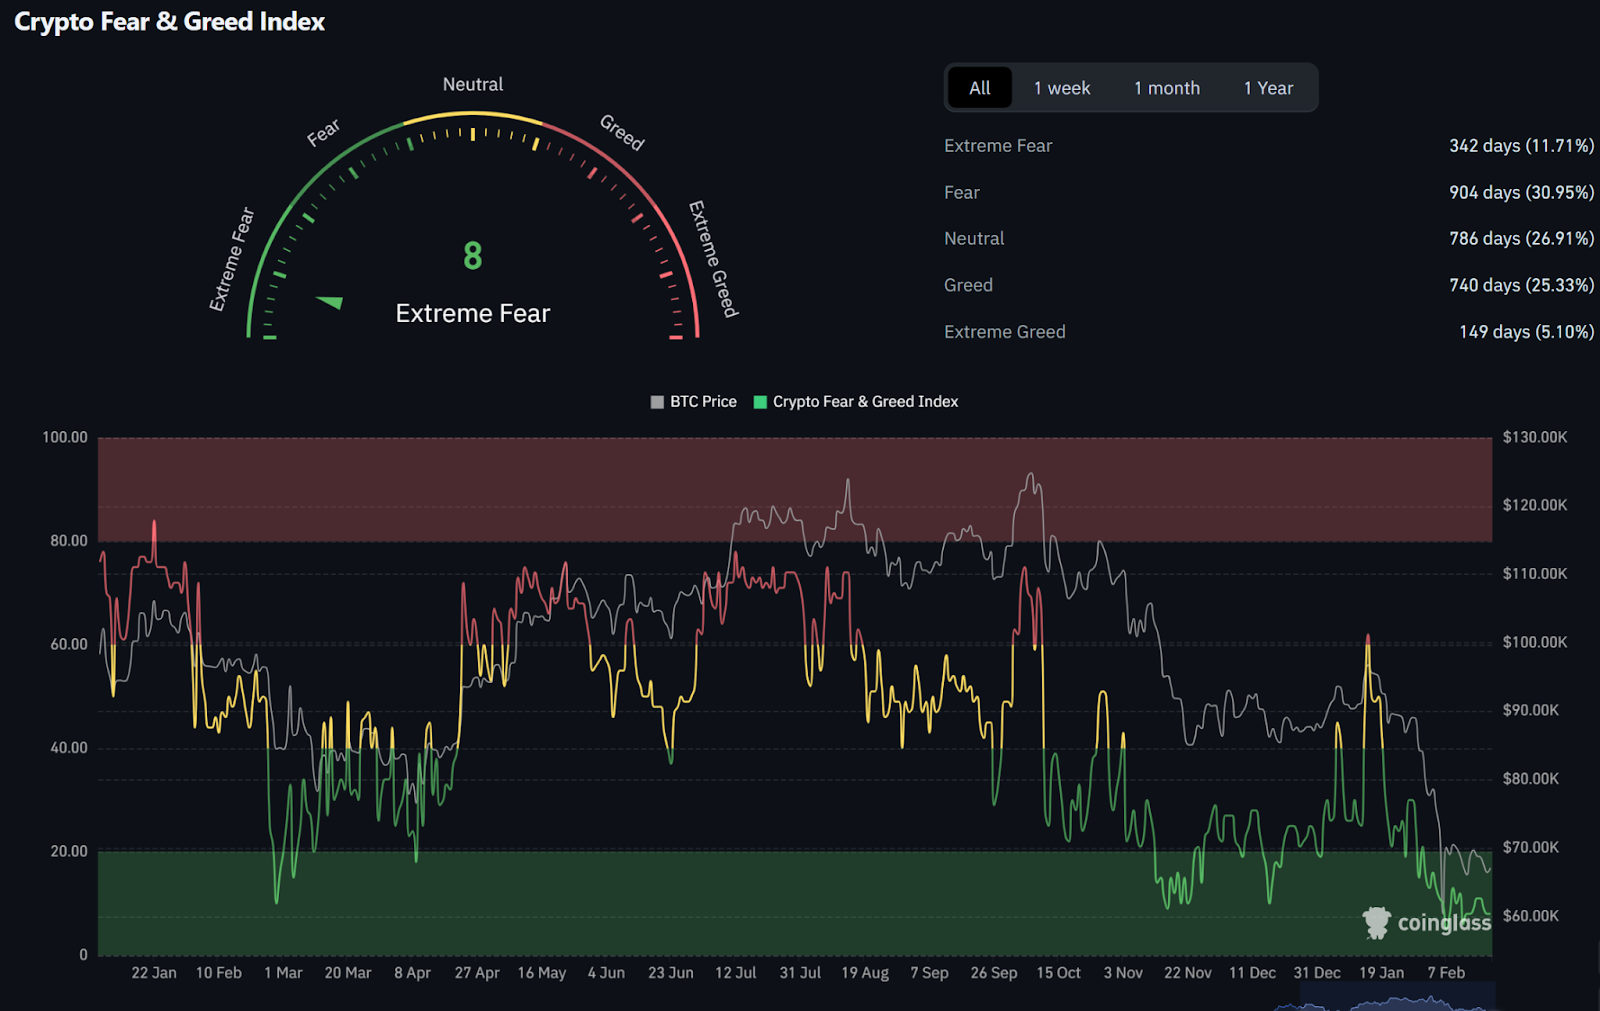
โดยถ้าดูจาก Fear & Greed Index ดัชนีในปัจจุบันอยู่ที่ 8 และเคยลงไปต่ำสุดที่ 5 (ถือเป็นค่าต่ำที่สุดเท่าที่เคยมีมา โดยอีกครั้งที่เคยลงไปถึงคือตอนเดือนสิงหาคม 2019) นอกจากนี้ ดัชนีได้แช่อยู่ในโซน Extreme Fear ต่อเนื่องยาวนานที่สุดนับตั้งแต่ปี 2022
ซึ่งถ้าดูจากประวัติศาสตร์บอกเราว่า ช่วงที่ดัชนีลงไปต่ำกว่า 10 นั้นมีไม่บ่อย จึงอาจตีความได้สองทางคือ ตลาดใกล้ถึงจุด Bottom แล้ว หรืออีกอย่างนึงคือเราอาจอยู่ในจุดนี้ได้นานกว่าที่คิด ตัวอย่างที่ชัดเจนที่สุดคือปี 2022 ที่ตลาดอยู่ในช่วง Extreme Fear ต่อเนื่องยาวนานในขณะที่ราคายังคงไหลลงเรื่อยๆ ได้
แม้ดัชนีความกลัวจะบ่งบอกถึงจุดต่ำสุดในเชิงจิตวิทยา แต่การยืนยันว่านี่คือ Bottom จริงหรือไม่ ต้องพิจารณาควบคู่ไปกับแรงขายจากฝั่ง ETF และการเคลื่อนไหวของ Stablecoin Supply ที่เราจะวิเคราะห์ในส่วนถัดไป
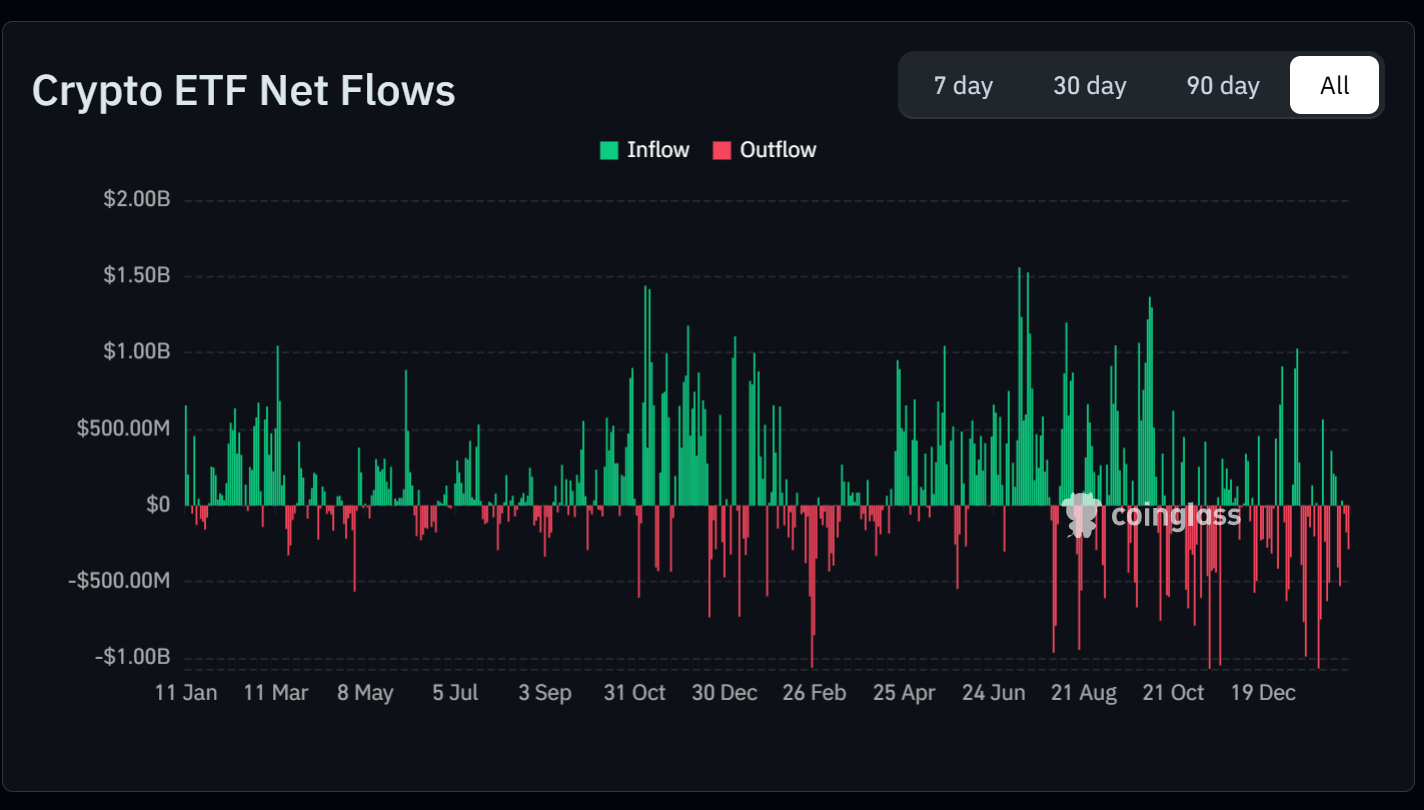
จากการวิเคราะห์กราฟ Crypto ETF Net Flows (ข้อมูลจาก Coinglass) ตั้งแต่ช่วงปลายปี 2025 จนถึงปัจจุบัน (กุมภาพันธ์ 2026) เราเห็นภาพการเปลี่ยนแปลงของ Fund Flow ที่สอดคล้องกับสภาวะตลาดอย่างชัดเจน โดยสามารถสรุปพฤติกรรมของ Fund Flow ได้ดังนี้:
1. ตุลาคม - พฤศจิกายน 2025
ในช่วงเดือนตุลาคมถึงพฤศจิกายน 2025 กราฟแสดงให้เห็นถึงแรงซื้อ (Inflow) ที่ยังคงพยายามผลักดันตลาด โดยมีแท่งสีเขียวพุ่งขึ้นไปแตะระดับ $1.00B - $1.30B ในบางวัน อย่างไรก็ตาม เริ่มมีแรงขาย (Outflow) แทรกเข้ามาเป็นระยะที่ระดับ -$500M สะท้อนถึงการทำกำไรของสถาบันบางกลุ่ม
2. ธันวาคม 2025:
เมื่อเข้าสู่เดือนธันวาคม 2025 รูปแบบของกราฟเปลี่ยนไปอย่างเห็นได้ชัด คือ Outflow เริ่มมีความถี่และขนาดที่ใหญ่ขึ้น โดยเราเห็นแรงขายระดับ -$1.00B ปรากฏขึ้นบ่อยครั้ง ในขณะเดียวกัน Inflow เริ่มแผ่วลงและไม่สามารถกลับไปแตะระดับ $1.50B เหมือนในช่วงกลางปีได้อีก เป็นสัญญาณว่าสภาพคล่องใหม่เริ่มหดตัวลง
3. มกราคม - กุมภาพันธ์ 2026
ในช่วงต้นปี 2026 จนถึงปัจจุบัน (กุมภาพันธ์) กราฟ Fund Flow สะท้อนถึงสภาวะ Institutional De-risking ค่อนข้างมาก โดยมีบางวันที่ยอดไหลออกสุทธิพุ่งทะลุระดับ -$1.00B และแม้จะมีแท่งสีเขียว (Inflow) สลับมาบ้าง แต่ส่วนใหญ่จะมีขนาดเล็กและไม่ต่อเนื่อง สะท้อนว่านักลงทุนสถาบันส่วนใหญ่ยังคงเลือกที่จะขายออกมากกว่า
สิ่งที่ต้องจับตาหลังจากนี้คือการกลับมาของแท่งสีเขียวที่สม่ำเสมอ ถ้าเรายังไม่เห็น Inflow ระดับ $500M+ ติดต่อกันหลายวัน ตลาดอาจจะยังคงอยู่ในสภาวะซึมตัวหรือปรับฐานต่อเนื่องไปอีกระยะ
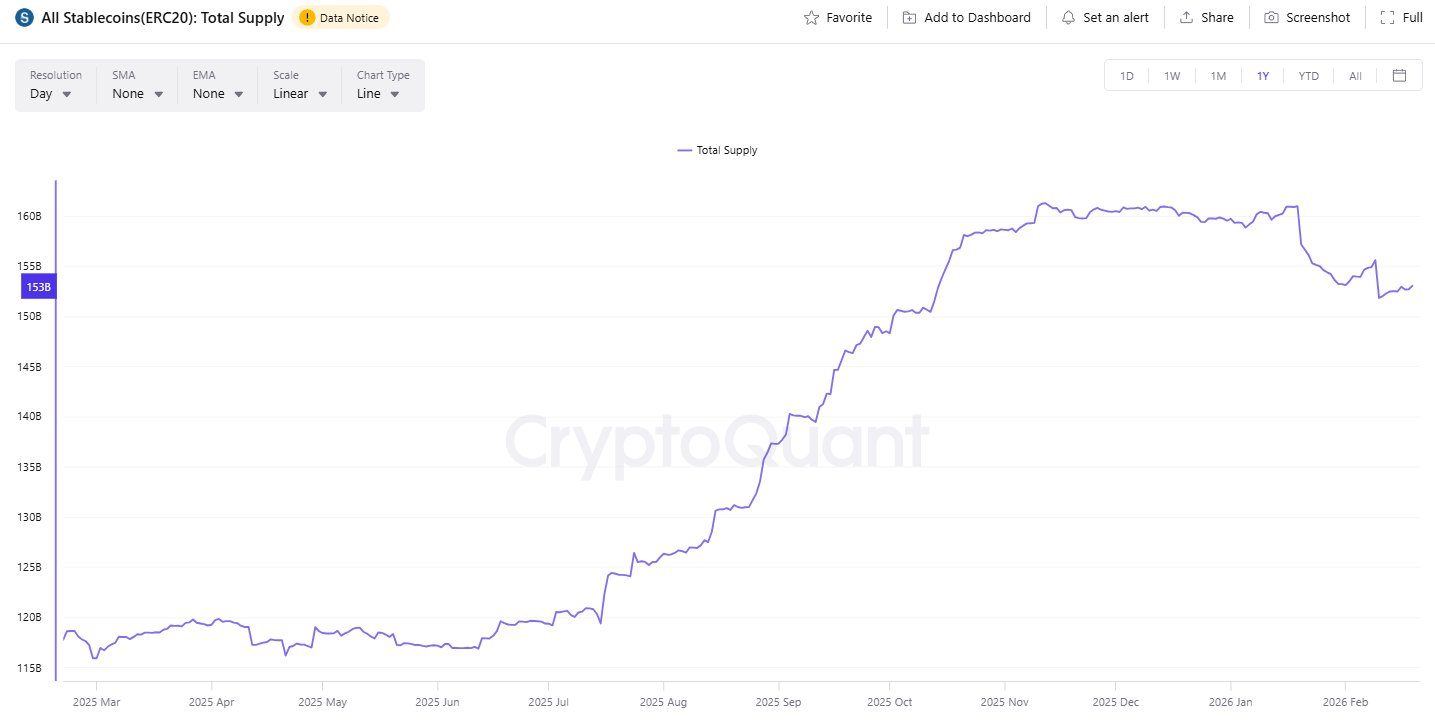
ถ้าเราดูที่ Total Stablecoin Supply เราจะเห็นว่าข้อมูลล่าสุดในเดือนกุมภาพันธ์ 2026 ปริมาณ Stablecoin ในระบบยังคงรักษาระดับไว้ได้เหนือ 150,000 ล้านดอลลาร์ แม้จะมีการปรับฐานลงมาจากจุดสูงสุดในช่วงปลายปี 2025 บ้าง แต่การที่ Supply ไม่ได้ดิ่งตามราคา Bitcoin ลงไป อาจเป็นการบอกได้ในระดับหนึ่งว่าเม็ดเงินส่วนใหญ่ยังไม่ได้ไหลออกจากคริปโตฯ แต่อาจถูกลดความเสี่ยงมาพักเป็น Stablecoin แทน
อย่างไรก็ตามสัญญาณที่ต้องระวังคือกราฟ Stablecoin Supply เริ่มมีการหักหัวลงในช่วงต้นปี 2026 สิ่งนี้เป็นจุดเปลี่ยนสำคัญที่ต้องจับตาดูต่อไปว่าแนวโน้มจะสามารถทรงตัวเพื่อรอจังหวะกลับเข้าซื้อ (Re-entry) หรือจะลงต่อ ซึ่งอาจหมายถึงการที่สภาพคล่องเริ่มไหลออกจากระบบคริปโตฯ เข้าสู่สินทรัพย์ปลอดภัยอื่น
หลังจากที่วิเคราะห์ปัจจัยต่างๆ มาทั้งหมด ลองมาสรุปภาพรวมให้ชัดขึ้นว่าตอนนี้ Indicator แต่ละตัวบอกอะไรเราบ้าง
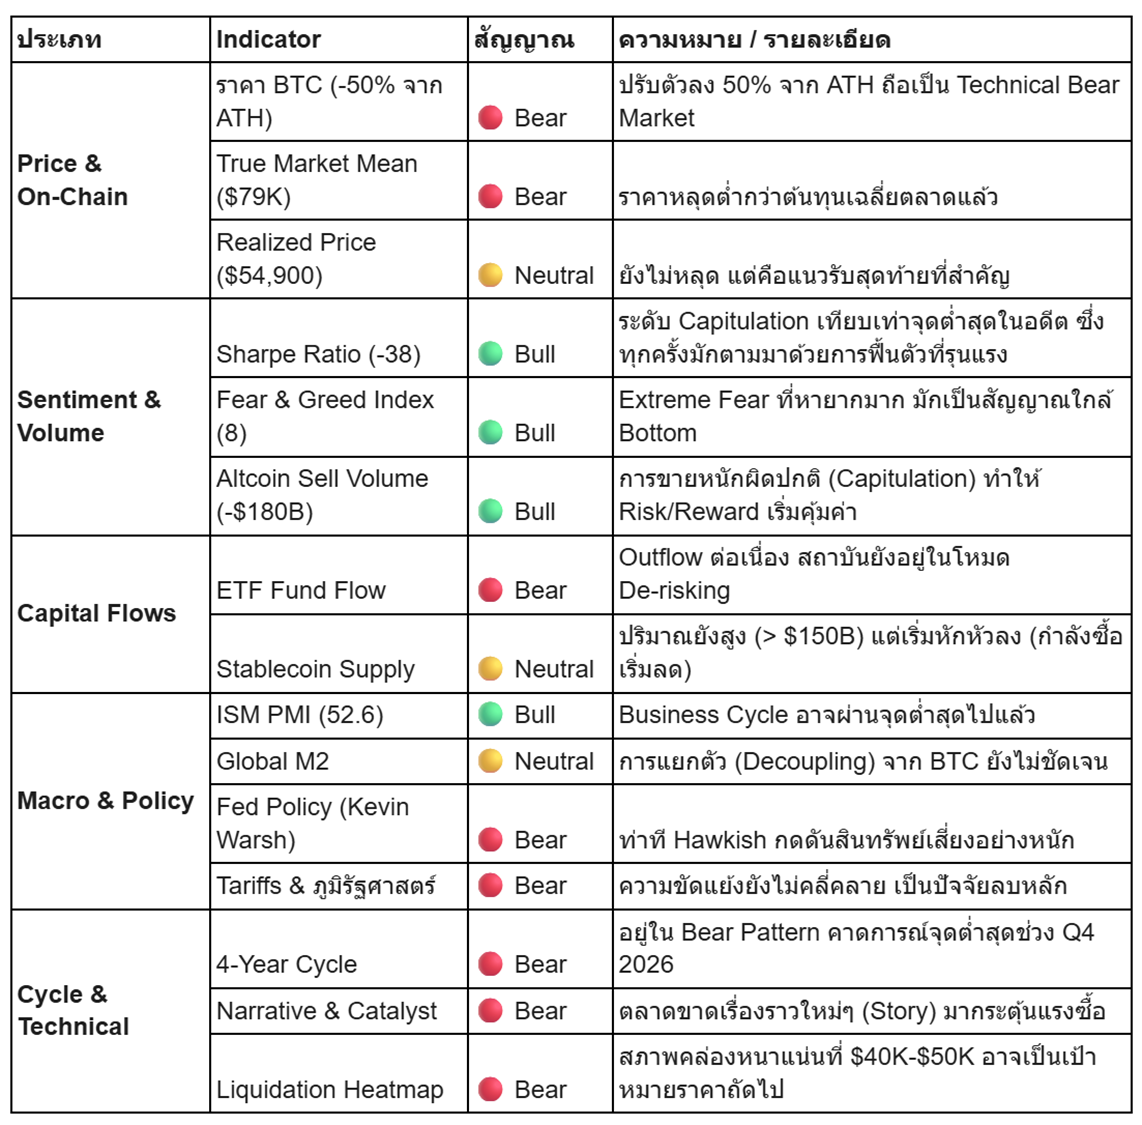
จากตารางจะเห็นว่าสัญญาณ Bear ยังมีน้ำหนักมากกว่า แต่สิ่งที่น่าสนใจคือ Indicator ที่เป็น Bull ส่วนมากเป็นสัญญาณเชิง Sentiment และ Onchain ที่บ่งชี้ว่าตลาดกำลังอยู่ในช่วง Late Bear หรือใกล้ถึงจุด Capitulation มากกว่าจะเป็นจุดเริ่มต้นของขาลงใหม่ กล่าวคือ ความเสี่ยงขาลงเริ่มจำกัดลง แต่ยังไม่มีสัญญาณยืนยันว่า Bottom มาถึงแล้ว และปัจจัยที่จะพลิกเกมได้จริงยังคงอยู่ที่ฝั่ง Macro ซึ่งอยู่นอกเหนือการควบคุมของตลาดคริปโตเอง
เนื่องจากสาเหตุหลักของการปรับฐานรอบนี้คาดว่ามาจาก Macro เป็นหลัก ดังนั้นปัจจัยสำคัญที่เราคาดว่าจะทำให้ตลาดกลับตัวได้ Macro จะต้องเปลี่ยนก่อน เพราะต้องยอมรับว่าไม่ว่า Onchain Signal หรือ Sentiment ดีแค่ไหน ก็ยากที่จะทำให้ตลาดฟื้นได้อย่างยั่งยืนถ้า Macro ยังกดดันอยู่ โดยอาจจับตาดูสัญญาณต่อไปนี้ เช่น
ปัจจัยเหล่านี้ไม่จำเป็นต้องเกิดขึ้นทั้งหมดพร้อมกัน แต่ถ้าเกิดขึ้นแม้แค่ 2-3 ข้อ ก็น่าจะเป็น Catalyst ที่แข็งแกร่งพอสำหรับการ Rebound ได้
นอกจาก Macro แล้ว Onchain Data คือสิ่งที่จะบอกได้ว่าแรงขายหมดจริงหรือยัง จับตาดูสัญญาณดังนี้
หนึ่งในสาเหตุที่ทำให้การฟื้นตัวของตลาดรอบนี้ยากกว่าที่คิด ไม่ใช่แค่เรื่อง Macro หรือ Sentiment แต่คือการที่ตลาดกำลัง ขาด Catalyst ใหม่ๆที่ใหญ่พอ
ถ้าย้อนดูทุกครั้งที่ตลาดคริปโตวิ่งขึ้นอย่างรุนแรง มักมี Catalyst ชัดเจนที่ดึงเม็ดเงินใหม่เข้ามาเสมอ ไม่ว่าจะเป็นการอนุมัติ Bitcoin Spot ETF ในต้นปี 2024 ที่เปิดประตูให้สถาบันเข้าถือ Bitcoin ได้อย่างเป็นทางการ, การชนะการเลือกตั้งของ Trump ที่ตลาดคาดหวังว่าจะนำมาซึ่งนโยบายที่เป็นมิตรกับคริปโต, หรือกระแส DeFi และ NFT ที่สร้าง Narrative ใหม่ดึงดูดนักลงทุนรายใหม่เข้ามาเป็นคลื่นๆ
แต่ในปัจจุบัน Catalyst เหล่านั้น ถูก Price in ไปหมดแล้ว ETF ก็มีแล้ว, Trump ก็เข้ามาแล้ว, สถาบันก็ซื้อแล้ว ตลาดจึงอยู่ในสภาวะที่เรียกว่า Narrative Vacuum หรือความว่างเปล่าของเรื่องราวใหม่ที่จะขับเคลื่อนตลาดไปข้างหน้า
สิ่งที่ทำให้สถานการณ์นี้น่ากังวลกว่าเดิมคือ ในช่วงขาลงตลาดต้องการ Catalyst ที่แข็งแกร่งเป็นพิเศษในการพลิกกลับ เพราะ Sentiment อยู่ใน Extreme Fear และสถาบันส่วนใหญ่กำลัง De-risking อยู่ การที่ไม่มีเรื่องราวใหม่ที่น่าตื่นเต้นพอจะดึงเม็ดเงินสดที่จอดอยู่ใน Stablecoin กลับเข้ามา ทำให้โอกาสที่ตลาดจะฟื้นตัวแบบ V-Shape นั้นค่อนข้างต่ำในระยะสั้น
Last February, the Bitcoin price dropped below $60,000 for the first time in 15 months, since reaching an All-time high of $126,210 just 4 months prior. Many view this not as a normal crash, but as an unwinding of a major uptrend driven by factors much more complex than the 2022 cycle, whether it be trade policy uncertainty, geopolitical tensions, or the Hawkish stance of the Fed under the new chair.
The question the market is asking is: is this a temporary correction or the beginning of a prolonged bear market? This article will analyze through On-chain signals, Macro factors, and institutional investor behavior to find the answer to where we are in the cycle and how we should prepare.
In early October 2025, the crypto market was in its best period of the year, with Bitcoin reaching an All-time high of $126,210. Bitcoin ETFs saw strong capital inflows; during the first 4 days of Q4, there were net inflows of $3.5 billion, pushing the total Assets Under Management (AUM) of Bitcoin ETFs to a peak of approximately $160,000-$170,000 million in early October 2025.
However, a major turning point occurred on October 10, 2025, when President Trump announced a 100% tariff on imported goods from China. This announcement severely impacted global financial markets, particularly the crypto market, becoming an event known as the "10/10 Crash."
On that day, the most severe flash crash in crypto history occurred, with more than $19 billion liquidated within 24 hours, causing Bitcoin to plunge more than 12-16% from the ~$122,000 level within a few hours.
This event became the turning point that pushed the crypto market into a continuous downtrend until the present. After October 10, the situation never truly recovered, and following this event, Bitcoin ETFs began experiencing continuous outflows as well, as seen in the green graph above.
Entering 2026, not only has the market not recovered, but crypto prices have continued to decline. In early February, a severe sell-off occurred:
The continuous decline reflects the pressure accumulated since late last year, which shows no signs of easing. Bitcoin price has now closed in the red for the fifth consecutive month, marking the first time in history that both January and February have closed negative back-to-back. Furthermore, if the price fails to recover and closes negative again this March, it will be only the second such occurrence in Bitcoin's entire lifespan, reflecting one of the most severe corrections ever.
The decline of Bitcoin has severely impacted Altcoins. Looking at the TOTAL2 chart (Total Altcoin Market Cap) since its peak in October 2025 at above $1.7 trillion, it is evident that the Altcoin market has entered a severe and continuous downtrend. The market value has plummeted by more than 40% within just a few months and crashed past the psychological level of $1 trillion in February 2026. This has resulted in the current Altcoin market cap sitting in a value zone of only approximately $960 billion.
In the case of Ethereum, the chart shows that the price entered a downtrend after peaking above $4,400 in October 2025. Currently, the price has dropped to test the $2,000 level, representing a decline of over 50% within just 6 months. The market condition in early 2026 reflects heavy selling pressure that has caused the price to continuously break through several key support levels, in line with the overall Altcoin market direction.
Looking at the DeFi TVL situation, it is evident that it aligns with the price direction. After TVL surged to a peak of nearly $180 billion in October 2025, the TVL value has currently decreased to approximately $90 billion, which is a decline of more than half within a few months.
In conclusion, looking at the overall market from Q4 2025 through Q1 2026, the correction trend is quite clear. This includes the Bitcoin price closing negative for 5 consecutive months, as well as Altcoin prices and DeFi TVL plunging severely. This leads us to assess that the market has technically entered a full-scale Bear Market.
However, to increase the accuracy of the situational assessment, this article will delve deeper into various signals, including On-chain, Macro, and Business Cycle data, to see exactly where we are in the cycle amidst this downturn and whether there are any hidden reversal signals.
In the next part, we will examine various factors to analyze the situation more clearly, starting with a very important factor: Macroeconomics.
It is undeniable that Macro is a key factor directly impacting crypto significantly. This area includes both negative and positive factors, such as:
The U.S. Federal Funds Rate currently stands at 3.5%-3.75% after the FOMC meeting on January 28, 2026, which decided to hold the rate for the first time following three consecutive rate cuts in 2025 (September, November, and December, totaling 75 basis points). The point to watch is the inflation situation, which remains above the 2% target, potentially preventing the Fed from rapidly cutting interest rates in 2026. Furthermore, the arrival of the new Fed Chair (Kevin Warsh), who holds a Hawkish stance, means the positive factor from rate cuts that risk asset markets expected may not occur as planned or provide as strong a tailwind as thought.
What complicates the situation further is the impact of Tariffs on inflation, as Tariff hike policies will lead to short-term inflation (Cost-push inflation) but may cause a long-term economic slowdown. This situation forces the Fed to face Stagflation risk, which is the worst-case scenario for risk assets.
Another factor exacerbating the market during January and February 2026 is the surging military tension between the U.S. and Iran. This event began with clashes in key strategic areas, impacting the crypto market and risk assets as investors moved to a Risk-off stance.
Another indicator many like to use is Global M2. According to historical statistics, Bitcoin's price often moves in the same direction as Global M2 with a lead time of approximately 10 weeks. However, recently, especially since the end of 2025, we are seeing a decoupling state, where the price is not following Global M2 as it should.
This can be interpreted in two ways:
Although the Fed officially announced the end of Quantitative Tightening (QT) on December 1, 2025 which should have been good news to unlock market liquidity, the situation in February 2026 did not meet investor expectations. There are three main reasons explaining why liquidity has not yet returned:
Balance Sheet Lag: Historically, such as in 2019, even when the Fed announced the end of QT, the balance sheet size did not immediately rebound because some bonds were still reaching maturity. Consequently, between December 2025 and January 2026, system liquidity remained low, and the market may have to wait until mid-2026 to see the actual effects.
Uncertainty from Kevin Warsh: The new Fed Chair took office just as QT ended, causing market concern. Even though QT has stopped, the Fed under his leadership might choose not to implement QE yet to control potential inflation spikes from tariff policies, rather than rushing to inject money into the system.
Trapped Liquidity: Even though the Fed has stopped withdrawing money, banks are choosing to hold more cash as reserves due to trade policy volatility and unresolved geopolitical risks. The result is that while the top level has stopped draining liquidity, the lower levels are not releasing it either, leaving the secondary market dry.
The key question investors are watching closely is: when will the Fed shift from stopping QT to implementing QE? We anticipate that QE might only occur if there are signs of a severe economic recession or a crisis in the bond market caused by U.S. debt and the impact of trade wars. If the economy only slows down while inflation remains high, the Fed may choose not to perform QE, which would continue to pressure crypto prices.
Charts from Sminston With and Plan C display Bitcoin price data and ISM PMI normalized as Z-scores over a 15-year period. The vertical green and red bars represent periods of economic expansion and contraction, respectively (typically defined by PMI being above or below 50, but for graphical readability, the 0 value is used as the dividing line).
Sminston With and Plan C concluded that the Bitcoin price aligns significantly with the Business Cycle. From the chart, it is evident that Bitcoin's Power Law Residual (orange line) has moved in sync with the PMI (blue line) across several cycles. Specifically, when the manufacturing sector expands, Bitcoin prices tend to increase; conversely, when the manufacturing sector contracts, Bitcoin prices tend to decrease.
Throughout 2025, the ISM PMI has consistently been in a contracting Business Cycle. However, the January 2026 PMI figure was announced at 52.6% (above 50 indicates expansion), which is a reversal upward. This may be a signal that the Business Cycle has passed its lowest point and is entering a new round, which is a positive factor for Bitcoin, suggesting that the next leg up may be coming if the economy is truly reversing from its bottom.
The 1-year Cumulative Buy/Sell Quote Volume Difference chart for Altcoins (excluding BTC and ETH) from CryptoQuant shows that recently, cumulative selling pressure in Altcoins has reached -$180 billion, a level never before seen in the history of the crypto market.
Compared to the 2022 Bear market, which was considered very severe, the Cumulative Sell Volume at that time did not plunge to this level. This reflects that the selling demand for Altcoins in the current round is significantly more intense and continuous.
However, a notable point is that despite such heavy selling pressure, the overall Altcoin market cap has not collapsed to levels much lower than the 2022 Bear market. This could be interpreted as there still being buying demand absorbing some of the selling pressure.
That said, this does not guarantee the market will reverse anytime soon, as selling pressure of this nature could continue if macro factors do not change. But historically, unusually severe Capitulation levels are often signals that long-term investors watch as points where the Risk/Reward begins to tilt in a more interesting direction.
True Market Mean is an on-chain indicator primarily used to assess the average Bitcoin acquisition cost of active participants. It focuses on Bitcoin that is actually traded and circulating in the secondary market by excluding Bitcoin produced by miners. This helps identify whether the market is in an overvalued or undervalued state. The assessment principle is that if the price falls below the True Market Mean, it typically signifies that we have entered a bear market.
According to the latest data in February 2026, the Bitcoin price has already broken below the key support level of the True Market Mean, which sits at approximately $79,000. The next target is the Realized Price (blue line), which acts as the final support level, currently situated at $54,900.
Looking at Bitcoin's Short-term Sharpe Ratio, which measures risk-adjusted returns, when this value is severely negative, it means the asset is generating high "pain" relative to volatility, leading to investor capitulation. This value has plunged to approximately -38, a level identical to the bear markets of 2015, 2019, and late 2022, all of which were cycle bottoms.
We might view this as a signal of the end of selling pressure or that selling momentum is exhausting, and it is usually not the start of a new major price drop. History tells us that after this signal occurs, a strong recovery typically follows. Simply put, this point is often where downside risk is already limited.
To see how far the price could potentially drop, we can look at the 2-year BTC Liquidation Heatmap from Coinglass. It is evident that the densest concentration of liquidations over the past two years is clustered at the $40,000 - $50,000 level, as shown by the bright yellow bands on the chart.
If the market undergoes a severe correction, the current price could be drawn down to perform a "Liquidation Hunt" in this range to clear out long positions that have accumulated over a long period. All the on-chain signals we see indicate the market is currently in a painful phase. But the question is: how severe is the current situation compared to previous cycles, and how much further can the market drop? To answer this, we must look back at historical bear markets in the next part.
In this part, we examine past bear markets in 2014, 2018, and 2022 according to the 4-Year Cycle theory to forecast the possibilities for the 2026 bear market.
Charts show that in every 4-year cycle, Bitcoin typically faces a major correction after reaching its peak. If we follow the 4-Year Cycle theory, it means we have already entered a bear market, as Bitcoin's price peak in October 2025 aligns perfectly with the expected timeline.
Interesting figures from past bear markets include:
A notable observation is that the percentage of the decline tends to decrease in each cycle as Bitcoin's market cap grows larger. If the reduction in drawdown remains linear, it is possible that in the 2026 bear market, Bitcoin may correct by about 65-70% from its ATH. This means the price could potentially drop to $37,000 - $44,000. Based on historical timelines, it is expected to reach the bottom during Q4 2026.
Analyzing the causes and mechanisms of the current market downturn reveals both improved conditions and more dangerous risks compared to previous cycles, specifically the most recent 2022 cycle.
In early 2026, market sentiment stands as one of the most stagnant in crypto history. Throughout 2024–2025, following Trump's inauguration, sentiment was largely driven by the expectation that his policies would be a net positive for crypto. However, entering 2026, this sentiment has turned into disappointment. It appears investors have realized that tariff policies do not favor risk assets, as they stimulate inflation and may force the Fed to maintain a Hawkish stance with high interest rates.
Furthermore, the belief that Bitcoin would serve as a "Safe Haven" during a trade war has been severely challenged as prices plunged alongside the stock market. This has triggered a "Narrative Crisis," or a loss of conceptual anchor for investors. We are also witnessing a massive portfolio rebalancing; while institutions have not sold off all their Bitcoin, they are opting for "De-risking" by reducing allocations to hold cash while awaiting clarity from the new Fed Chair (Kevin Warsh).
On the retail investor side, sentiment has entered a state of "Apathy." Google Search Trends for "Bitcoin" and "Crypto" in February 2026 dropped to an 18-month low, reflecting that retail participants are losing heart and exiting the market.
If we look at the Fear & Greed Index, the current index stands at 8 and previously reached a low of 5 (marking the lowest value ever recorded, a level only previously hit in August 2019). Furthermore, the index has remained submerged in the Extreme Fear zone for the longest continuous period since 2022.
History tells us that instances where the index drops below 10 are rare. This can be interpreted in two ways: either the market is nearing a bottom, or we may remain at this level longer than expected. The clearest example is 2022, when the market stayed in Extreme Fear for a prolonged period while the price continued to slide lower.
While the fear index indicates a psychological low, confirming whether this is the actual bottom requires looking at ETF selling pressure and Stablecoin Supply movements, which we will analyze in the next section.
Based on the analysis of Crypto ETF Net Flows (data from Coinglass and SosoValue) from late 2025 to the present (February 2026), the fund flow shifts clearly align with market conditions as follows:
1. October – November 2025 During October and November 2025, the charts show that buying pressure (Inflows) was still attempting to drive the market, with green bars hitting levels of $1.00B – $1.30B on some days. However, selling pressure (Outflows) began to intersperse at around -$500M, reflecting profit-taking by certain institutional groups.
2. December 2025 Entering December 2025, the chart pattern changed significantly. Outflows became more frequent and larger in scale, with selling pressure reaching -$1.00B appearing often. Meanwhile, Inflows began to fade and could no longer reach the $1.50B levels seen mid-year, signaling a contraction in new liquidity.
3. January – February 2026 From the start of 2026 to the present (February), fund flow data reflects substantial Institutional De-risking. On several days, net daily outflows spiked past -$1.00B. While some green bars (Inflows) appeared, they were mostly small and inconsistent, indicating that the majority of institutional investors continue to favor exiting over accumulation.
The key factor to watch moving forward is the return of consistent green bars. Without sustained Inflows of $500M+ over consecutive days, the market may remain in a stagnant state or continue its correction for some time.
If we look at the Total Stablecoin Supply, we can see that the latest data in February 2026 shows the volume of stablecoins in the system remains above $150 billion. Although there has been some correction from the peak in late 2025, the fact that the supply did not plunge along with Bitcoin's price suggests to some extent that most of the money has not yet flowed out of crypto, but may instead have been de-risked and moved into stablecoins.
However, a signal to be cautious of is that the Stablecoin Supply chart has begun to turn downward in early 2026. This is a crucial turning point to watch: whether the trend can stabilize to wait for a re-entry opportunity or continue to decline, which could mean liquidity is starting to flow out of the crypto system into other safe-haven assets.
After analyzing all the factors, let's summarize the overall picture of what each indicator is telling us as of early March 2026.
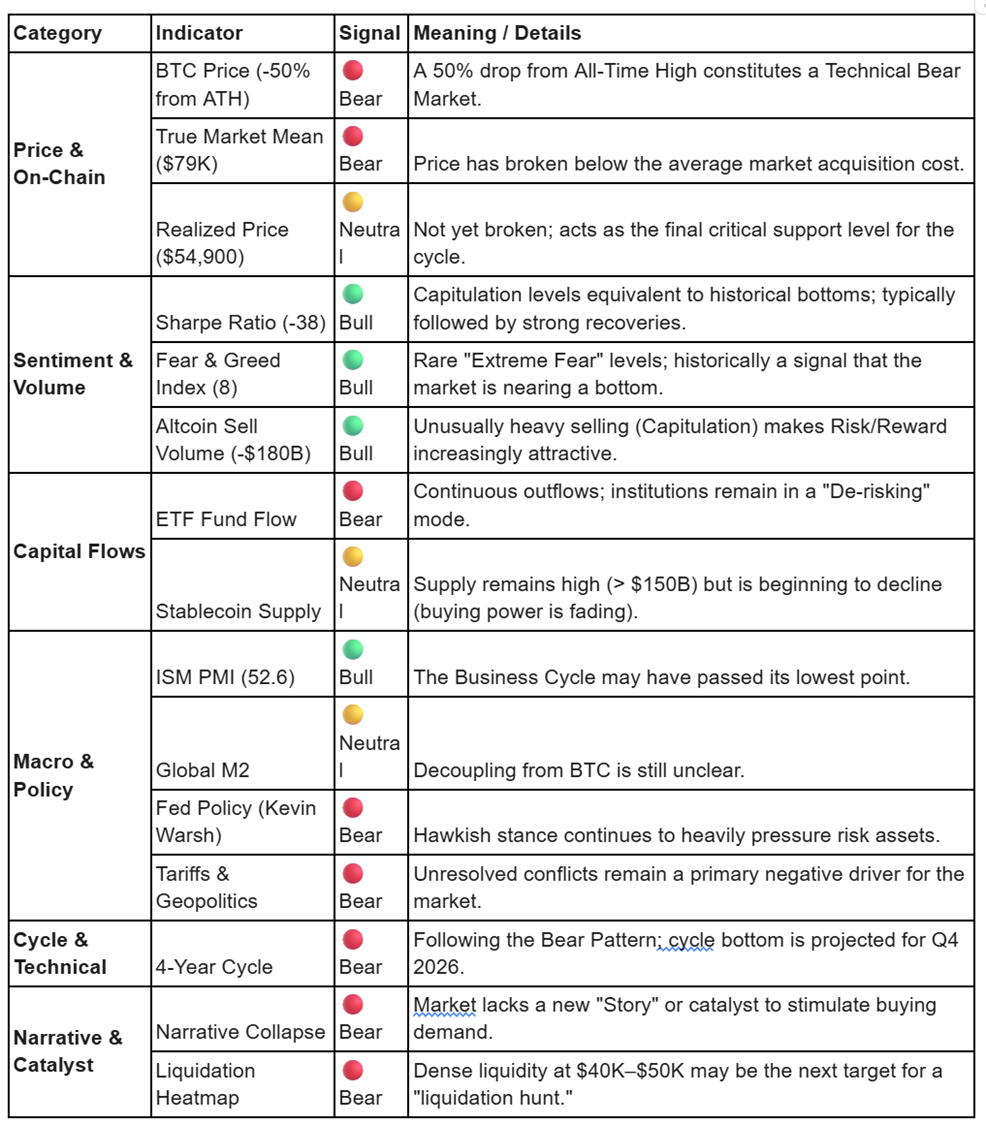
The table indicates that bearish signals still carry more weight. However, it is noteworthy that most bullish indicators are sentiment and on-chain metrics, suggesting the market is in a Late Bear phase or approaching Capitulation rather than the start of a new downtrend. In other words, downside risk is becoming limited, but there is no confirmed signal that the bottom is in. The true "game-changer" remains the Macro environment, which is currently beyond the crypto market's internal control.
Since the primary cause of this correction is rooted in Macro factors, the reversal will likely require a shift in the global landscape. No matter how strong on-chain signals or sentiment become, a sustainable recovery is difficult while Macro pressure persists. Key signals to watch include:
On-chain data will be the ultimate arbiter of whether selling pressure has truly exhausted. Watch for:
One reason this recovery is more difficult than expected is a lack of new, large-scale catalysts.
Historically, every major crypto bull run was fueled by a clear narrative: the 2024 Spot ETF approval, the "Trump Trade" expectations, or the DeFi/NFT Summer. Currently, these catalysts have been "priced in." The ETFs exist, Trump is in office, and institutions have already made their initial entries. The market is now in a Narrative Vacuum—a void where no new story is currently powerful enough to drive the next wave of capital.
This is particularly concerning during a downturn. When sentiment is in "Extreme Fear" and institutions are de-risking, the market needs an exceptionally strong reason to move cash out of stablecoins and back into volatile assets. Without a fresh, exciting narrative, the likelihood of a V-shaped recovery in the short term remains low.


.png)

.jpg)
.jpg)


