


.jpg)
Bitcoin
News Analysis
March 17, 2026

เงินกลับมาไหลเข้า ETF คริปโตฯ ต่อเนื่องหลายวัน! สัญญาณบวกตลาดกลับมาหรือไม่
หลังจากที่เงินไหลออกจากคริปโตฯ ETF โดยไม่สามารถคงการไหลกลับเข้าได้อย่างต่อเนื่อง ข้อมูลล่าสุด เราเริ่มเห็นสัญญาณฟื้นตัวที่น่าจับตามองของตลาดเพราะ ETF ของคริปโตฯ โดยเฉพาะอย่างยิ่งสำหรับเหรียญตัวหลักอย่าง Bitcoin, Ethereum และ Solana ซึ่งกระแส Inflow ได้กลับมาไหลเข้าต่อเนื่องหลายวันแล้ว
และหนึ่งใน Catalyst สำคัญที่หลายคนมองว่าเป็นแรงหนุนของกระแสดังกล่าว คือข่าวใหญ่จากยักษ์อย่าง BlackRock ที่เปิดตัวกองทุน iShares Staked Ethereum Trust ETF หรือ $ETHB บน Nasdaq อย่างเป็นทางการเมื่อวันที่ 12 มีนาคม 2026 ที่ผ่านมา
$ETHB หรือ iShares Staked Ethereum Trust ETF ถือเป็นก้าวสำคัญของ BlackRock เพราะเป็นครั้งแรกของ BlackRock ที่ออกผลิตภัณฑ์ผสานการถือ ETH แบบ Spot เข้ากับการรับผลตอบแทนจาก Native Staking ซึ่งหมายความว่านักลงทุนไม่ได้แค่ได้รับผลตอบแทนจากการขึ้นของราคา ETH เท่านั้น แต่ยังได้รับ Staking Yield โดยตรงอีกด้วย

$ETHB ยังนับเป็น ETF คริปโตฯ ตัวที่ 3 ของ BlackRock ต่อจาก IBIT (Bitcoin ETF ที่มี AUM สูงถึง $55,000 ล้านดอลลาร์) และ ETHA (Ethereum Spot ETF ที่มี AUM $6,500 ล้านดอลลาร์) ส่งผลให้ปัจจุบัน BlackRock บริหารสินทรัพย์ที่เกี่ยวข้องกับคริปโตฯ รวมกันทะลุ $130,000 ล้านดอลลาร์ แล้ว
การเคลื่อนไหวครั้งนี้ของ BlackRock ย้ำถึงความเชื่อมั่นของสถาบันการเงินรายใหญ่ต่อเหรียญหลักคริปโตฯอย่าง Ethereum นอกจากนี้ ยังเป็นสัญญาณว่าตลาด ETF คริปโตฯ กำลังก้าวเข้าสู่บทใหม่ที่ซับซ้อนและน่าสนใจยิ่งขึ้น เมื่อผู้ลงทุนสามารถรับทั้ง Capital Gain และ Staking Yield ได้พร้อมกันภายในกองทุนเดียว
ถ้าย้อนดูข้อมูลการไหลของเงินใน Crypto ETF ตั้งแต่เดือนพฤศจิกายน 2025 จนถึงปัจจุบัน เราสามารถสรุปออกเป็นช่วงๆ ได้ดังนี้
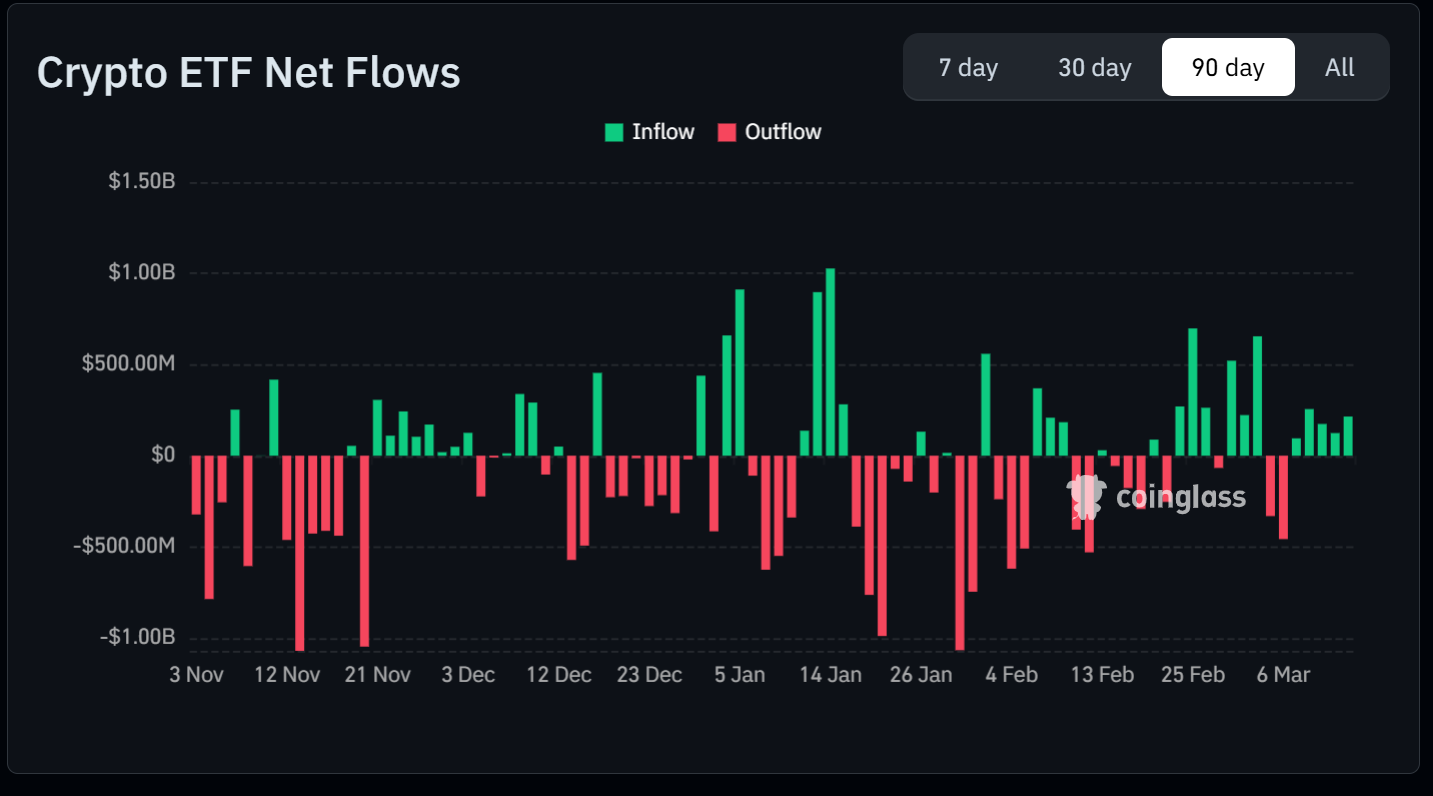
ตั้งแต่เดือนพฤศจิกายน 2025 หลังจากการเกิดวิกฤติในวันที่ 10 ตุลาคม เป็นจุดเริ่มต้นของแรงกดดัน โดยมีเงินไหลออก (Outflow) สูงสุดแตะระดับใกล้ 1,000 ล้านดอลลาร์ ในวันเดียว ทำให้ภาพรวมเดือนพฤศจิกายนเป็นสีแดงเป็นหลัก
เดือนธันวาคมเริ่มเห็นสัญญาณฟื้นตัวบ้าง ก่อนที่ช่วง 5–14 มกราคม 2026 จะเป็นจุดพีคที่สำคัญที่สุด โดยมีเงินไหลเข้าต่อเนื่องหลายวัน บางวันพุ่งสูงถึงเกือบ 900–1,000 ล้านดอลลาร์ ตลาดดูเหมือนจะกลับมาร้อนแรงอีกครั้งในช่วงต้นปีใหม่
ในช่วงต้นเดือนกุมภาพันธ์ 2026 มีการไหลออกสุทธิที่หนักที่สุดในรอบ 90 วัน โดยวันที่เลวร้ายสุดมีเงินไหลออกทะลุ -$1,000 ล้านดอลลาร์ นักวิเคราะห์ส่วนใหญ่มองว่าเป็นผลพวงจากความไม่แน่นอนด้านนโยบาย เศรษฐกิจมหภาค และแรงขายทำกำไรหลังช่วง January rally
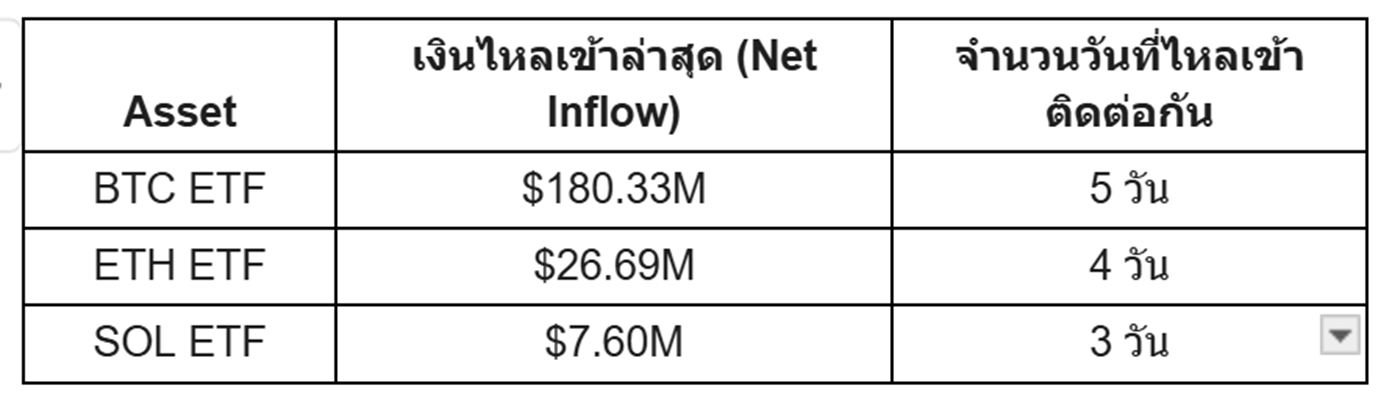
หลังจากผ่านพ้นช่วงขาลงที่หนักหน่วง กราฟในช่วงปลายกุมภาพันธ์ต่อเนื่องถึงต้นมีนาคม 2026 เริ่มเปลี่ยนเป็นสีเขียวอย่างสม่ำเสมอมากขึ้น และล่าสุดวันที่ 13 มีนาคม 2026 เราจะเห็นการไหลเข้าที่ต่อเนื่องใน ETF ของเหรียญคริปโตฯหลัก โดยสรุปดังนี้
กองทุน Bitcoin Spot ETF ดึงดูดเงินไหลเข้าสูงถึง 180.33 ล้านดอลลาร์ในวันเดียว และถือเป็นวันที่ 5 ติดต่อกันที่เงินไหลเข้า ปัจจุบันมูลค่าสินทรัพย์รวมภายใต้การจัดการ (Total Net Assets) ของ Bitcoin ETF ทั้งหมดอยู่ที่ 91,830 ล้านดอลลาร์ ขณะที่ราคา BTC ล่าสุดอยู่แถว $74,000
ETF ของ Ethereum มีเงินไหลเข้า 26.69 ล้านดอลลาร์ เป็นวันที่ 4 ติดต่อกัน สะท้อนความสนใจจากนักลงทุนสถาบันที่กลับมาสะสม ETH อีกครั้ง ส่วนหนึ่งอาจมาจากการเปิดกอง ETHB ของ BlackRock โดยราคา ETH ณ ขณะนั้นอยู่ที่ประมาณ $2,200
แม้จะเป็นตัวเล็กสุดในสามตัว แต่ SOL ETF ก็มีเงินไหลเข้า 7.60 ล้านดอลลาร์ เป็นวันที่ 3 ติดต่อกัน ซึ่งถือเป็นสัญญาณว่านักลงทุนเริ่มให้ความสนใจ Solana ในฐานะสินทรัพย์ระดับสถาบันมากขึ้น ราคา SOL อยู่ที่ประมาณ $90
การที่ทั้ง BTC ETF, ETH ETF และ SOL ETF มีเงินไหลเข้าเป็นบวกพร้อมกัน ประกอบกับแนวโน้มจากกราฟ Coinglass ที่เห็นว่าแท่งแดงเริ่มสั้นลง และแท่งเขียวเริ่มมีความต่อเนื่อง ถือเป็นหนึ่งในสัญญาณบวกที่น่าเชื่อถือที่สุดในรอบหลายเดือนก็ว่าได้
ถ้า BTC ETF สามารถรักษากระแส Inflow ต่อเนื่องได้ถึง 7-10 วัน จะถือเป็นสัญญาณที่แข็งแกร่งมากขึ้นอีกระดับ โดยเฉพาะอย่างยิ่งถ้าประกอบกับราคา BTC สามารถยืนเหนือ $73,000 ได้ อาจเป็น Setup ที่เอื้อต่อสัญญาณต่อตลาดคริปโตฯ โดยรวมต่อไปได้ ขณะเดียวกัน ถ้าการคลื่อนไหวของ ETH และ SOL ETF สามารถรักษาการไหลเข้าต่อเนื่องได้เช่นกัน ก็อาจเป็นสัญญาณบ่งชี้ว่าตลาด Altcoin โดยรวมอาจกำลังเริ่มฟื้นตัวตามมาด้วย
อย่างไรก็ตาม เราควรระวัง False Signal ด้วย เพราะในช่วงมกราคมที่ผ่านมาก็เคยมี Inflow Streak ที่แข็งแกร่งเช่นกัน ก่อนที่จะพลิกกลับมาเป็น Outflow ขนาดใหญ่ในเวลาไม่นาน จึงต้องมีการจับตาดูทิศทางกระแสเงินทุนต่อเนื่องรายวันควบคู่ไปด้วย
แม้สัญญาณในตอนนี้จะดูเป็นบวก แต่ตลาดคริปโตฯ ก็ไม่เคยขาดปัจจัยที่พร้อมพลิกสถานการณ์ได้ตลอดเวลา โดยปัจจัยเสี่ยงหลักที่ควรติดตามอย่างใกล้ชิด มีดังนี้
นอกจากการดู ETF แล้ว เรายังสามารถดูสัญญาณ On-Chain ประกอบว่าตลาดกำลังอยู่ในสภาวะอะไร และสัญญาณสองตัวที่น่าสนใจในขณะนี้ก็ชี้ไปในทิศทางเดียวกันกับกระแส ETF Inflow
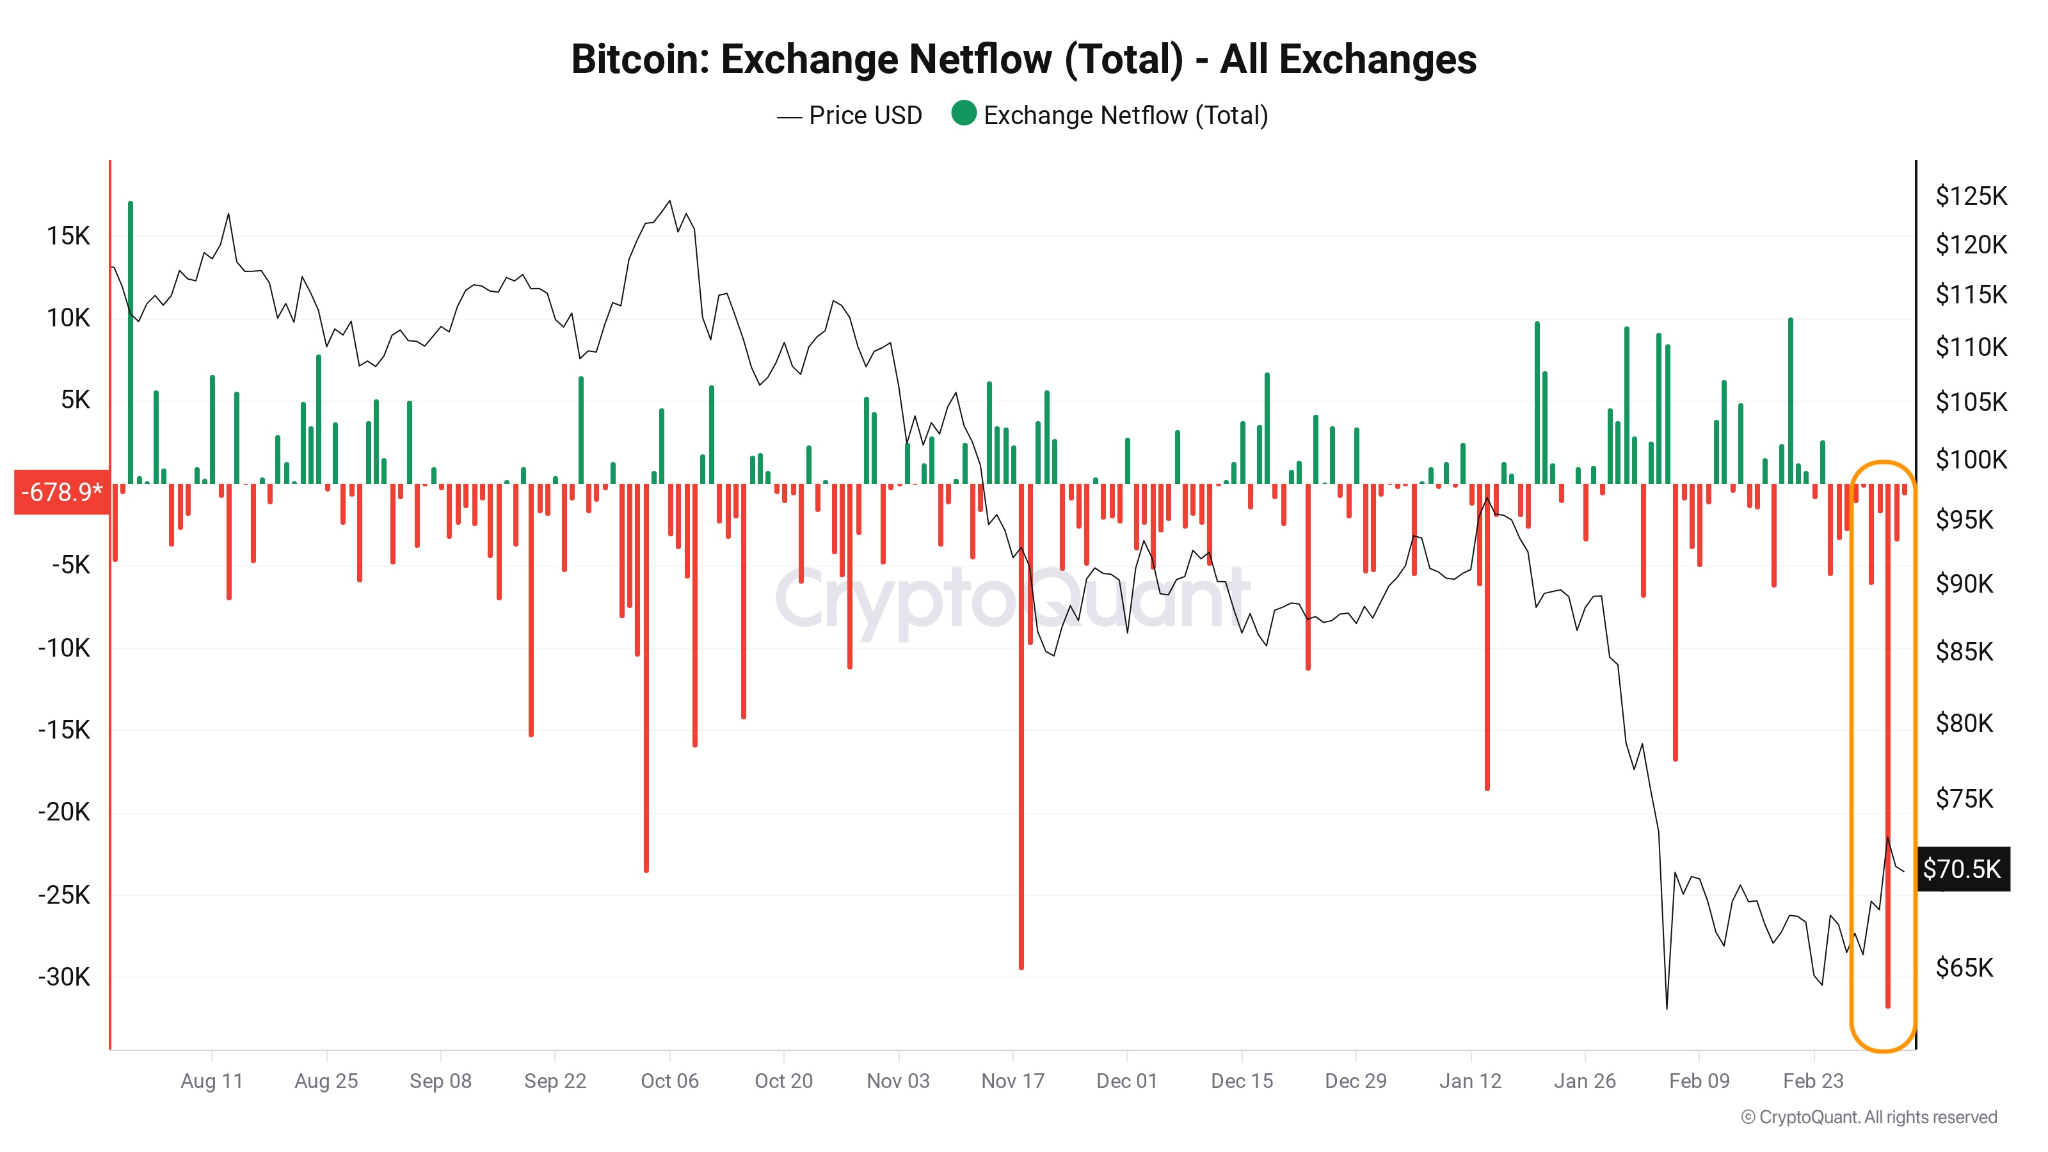
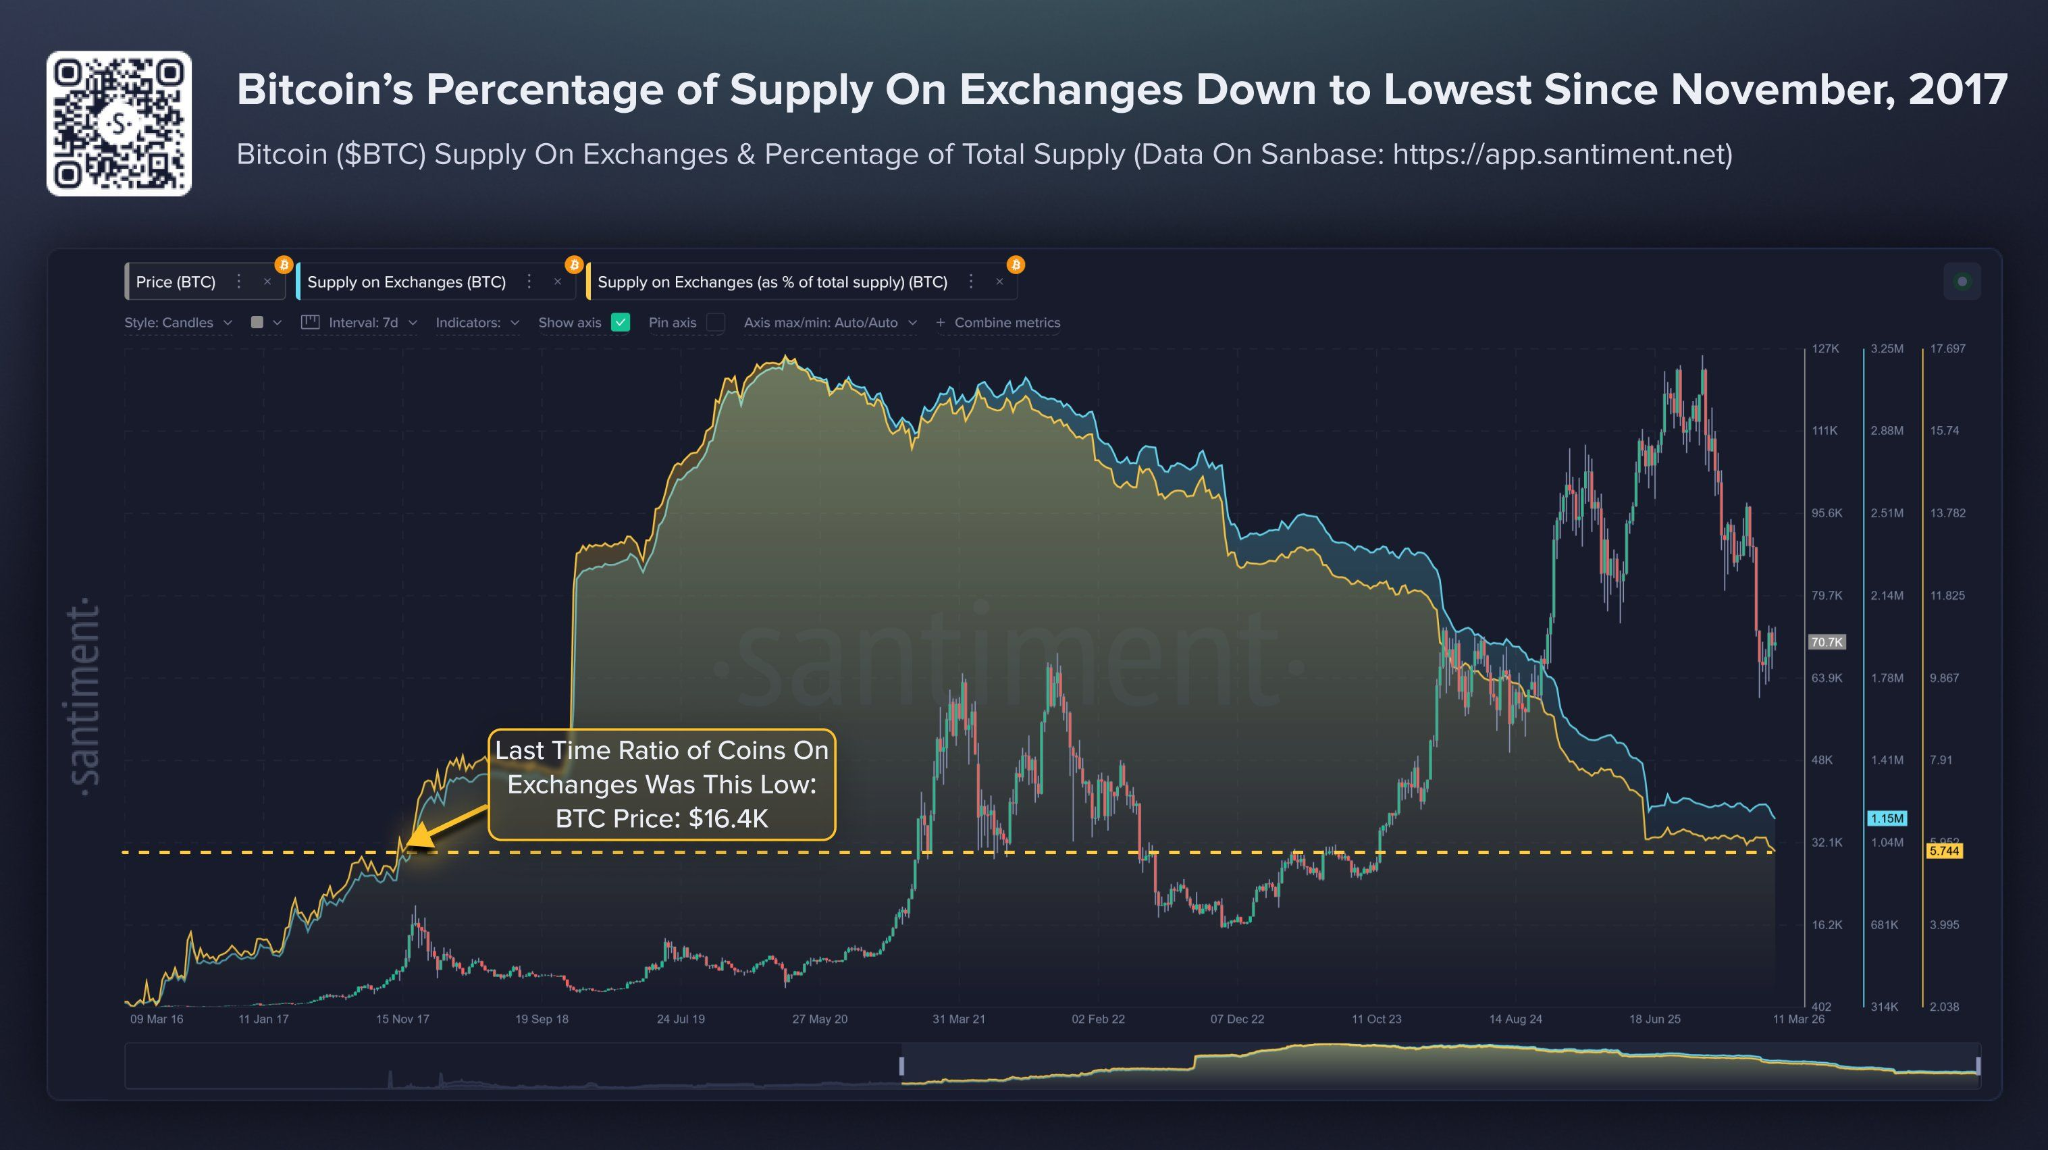
ในช่วงที่ผ่านมา ปริมาณ BTC ที่ถูกถอนออกจาก Exchange มีแนวโน้มเพิ่มขึ้นอย่างต่อเนื่อง รวมถึง ปริมาณ BTC ที่ฝากอยู่บน Exchange ยังลดลงสู่ระดับต่ำสุดนับตั้งแต่ปลายปี 2017 ซึ่งในภาษา On-Chain ถือเป็นสัญญาณบวก เพราะหมายความว่านักลงทุนกำลังย้าย BTC ออกจากตลาดไปเก็บไว้ใน Wallet ส่วนตัว แทนที่จะฝากไว้ใน Exchange เพื่อรอขาย และเมื่อ Supply บน Exchange ลดลงเรื่อย ๆ ก็ยิ่งทำให้แรงขายในตลาดลดน้อยลงตามไปด้วย
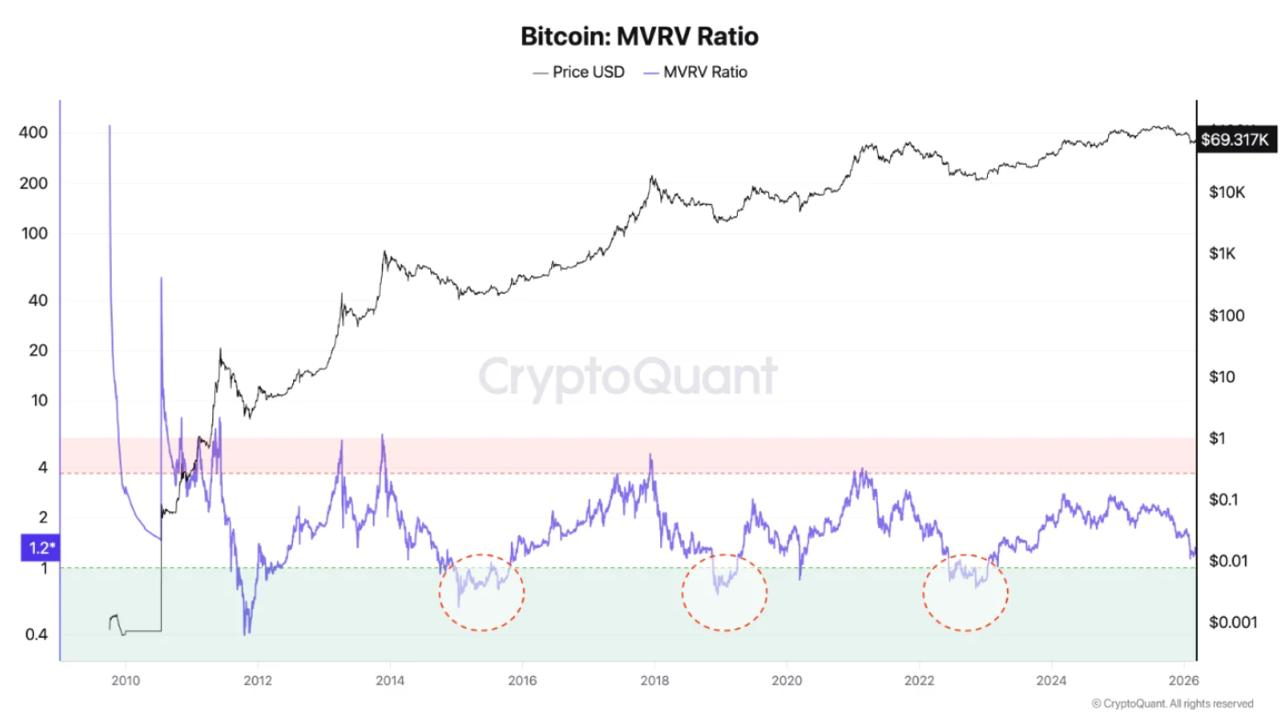
MVRV Ratio (Market Value to Realized Value) เป็นตัวชี้วัดที่เปรียบเทียบมูลค่าตลาดปัจจุบันของ BTC กับต้นทุนเฉลี่ยที่นักลงทุนทุกรายในระบบเคยจ่ายไป โดยหลักการง่าย ๆ คือหาก MVRV สูงกว่า 3.5 มักบ่งชี้ว่าตลาดร้อนแรงเกินไปและมีความเสี่ยงที่จะเกิด Correction ขณะที่ค่าต่ำกว่า 1 มักเป็นโซนสะสมที่ดี ปัจจุบัน MVRV ของ BTC อยู่ในระดับประมาณ 1.2 ซึ่งถือว่าเริ่มเข้าสู่โซน Accumulation Zone ที่นักลงทุนระยะยาวมักมองว่าเป็นจังหวะที่น่าสนใจ
นอกจากนี้ ถ้าดูจาก MVRV Z-Score ตอนนี้อยู่ที่ 0.38 ซึ่งถ้าดูจากข้อมูลในประวัติศาสตร์ค่านี้ลดลงต่ำกว่า 0.5 เพียงแค่ 6 ครั้งเท่านั้น ซึ่งแทบทุกครั้งเป็นจุดที่บ่งบอกว่าตลาดอยู่ในจุด Bottom
ตลาด ETF คริปโตฯ ในตอนนี้อาจเรียกได้ว่ากำลังอยู่ในจุดที่น่าสนใจที่สุดในรอบหลายเดือน เมื่อกระแส Inflow กลับมาต่อเนื่องพร้อมกันทั้ง BTC, ETH และ SOL ขณะที่ BlackRock เพิ่งเปิดตัว $ETHB ซึ่งเป็นสัญญาณว่าสถาบันการเงินระดับโลกยังคงเดินหน้าลงทุนและผลักดันคริปโตฯต่อเนื่อง นอกจากนี้ สัญญาณ Onchain หลายๆตัวก็กำลังบอกเราว่าตลาดอยู่ในโซนที่ Risk ค่อนข้างต่ำ
อย่างไรก็ตาม ประวัติศาสตร์สอนให้รู้ว่าตลาดคริปโตฯ สามารถพลิกผันได้เสมอ ไม่ว่าจะเป็นจากนโยบายการเงิน ภูมิรัฐศาสตร์ หรือแรงขายที่ไม่คาดคิด การติดตามข้อมูล ETF Flow รายวันจึงเป็นสิ่งที่ไม่ควรมองข้าม เพราะคือหนึ่งในตัวชี้วัดที่สะท้อน Sentiment ของเงินสถาบันได้ชัดเจนที่สุด
_______________________________________________________________________________________________________
Following a period of crypto ETF outflows that struggled to maintain consistent reversals, recent data shows a noteworthy recovery. Inflows have returned for several consecutive days, particularly for major assets like Bitcoin, Ethereum, and Solana.
A primary catalyst for this momentum is the major announcement from BlackRock, which officially launched the iShares Staked Ethereum Trust ETF ($ETHB) on Nasdaq on March 12, 2026.
The $ETHB (iShares Staked Ethereum Trust ETF) represents a milestone for BlackRock. It is the first time the firm has combined spot ETH holdings with native staking rewards. This structure allows investors to benefit not only from ETH price appreciation but also from the staking yield directly within the fund.
$ETHB marks BlackRock’s third crypto ETF, following IBIT (a Bitcoin ETF with an AUM of $55 billion) and ETHA (an Ethereum Spot ETF with an AUM of $6.5 billion). This brings BlackRock’s total crypto-related assets under management to over $130 billion.
This move by BlackRock reinforces the confidence of major financial institutions in core crypto assets like Ethereum. Furthermore, it signals that the crypto ETF market is entering a more sophisticated new chapter, where investors can capture both capital gains and staking yields simultaneously within a single fund.
Reviewing the capital flow data for crypto ETFs from November 2025 to the present, the trends can be categorized into the following periods:
Starting in November 2025, following the crisis on October 10, selling pressure began to mount. Outflows peaked at nearly $1 billion in a single day, leaving the overall outlook for November primarily in the red.
December began to show signs of recovery before hitting a major peak between January 5–14, 2026. Consistent inflows were seen over several days, with some daily figures surging to nearly $900–$1,000 million. The market appeared to heat up again at the start of the New Year.
In early February 2026, the market experienced the heaviest net outflows of the 90-day period. At its worst, daily outflows surpassed -$1 billion. Most analysts attributed this to macroeconomic policy uncertainty and profit-taking following the January rally.
After navigating a heavy downturn, the charts from late February through early March 2026 have consistently turned green. As of March 13, 2026, we are seeing sustained inflows into major crypto ETFs, summarized as follows:
The fact that BTC ETFs, ETH ETFs, and SOL ETFs are seeing simultaneous positive inflows, combined with the trend from Coinglass charts showing shortening red bars and increasing consistency in green bars, represents one of the most reliable bullish signals seen in several months.
If BTC ETFs can maintain consistent inflows for 7–10 days, it would represent a significantly stronger signal. Specifically, if combined with the BTC price holding above $73,000, it could create a favorable setup for the overall crypto market. Meanwhile, if ETH and SOL ETFs also maintain steady inflows, it may indicate that the broader Altcoin market is beginning to recover as well.
However, caution regarding false signals is necessary. As seen in January, a strong inflow streak can quickly pivot back to large outflows. Therefore, daily monitoring of fund flow directions remains essential.
Despite the current positive signs, the crypto market remains subject to factors that can shift the situation at any time. Key risk factors to monitor closely include:
Beyond ETFs, on-chain signals provide further context. Two currently interesting indicators align with the ETF inflow trend:
Recently, the volume of BTC withdrawn from exchanges has shown a steady upward trend. Furthermore, the amount of BTC deposited on exchanges has dropped to its lowest level since late 2017. In on-chain terms, this is considered a bullish signal, as it indicates that investors are moving BTC out of the market into private wallets rather than keeping it on exchanges ready to sell. As exchange supply continues to decrease, the potential selling pressure in the market diminishes accordingly.
The MVRV Ratio (Market Value to Realized Value) is a metric that compares the current market value of BTC to the average cost basis paid by all investors in the system. Simply put, an MVRV above 3.5 usually indicates an overheated market at risk of a correction, while a value below 1 typically signals a prime accumulation zone. Currently, the BTC MVRV sits at approximately 1.2, which is entering the Accumulation Zone that long-term investors often view as an attractive entry point.
Furthermore, the MVRV Z-Score is currently at 0.38. Historically, this value has dropped below 0.5 only six times, and nearly every instance marked a market bottom.
The crypto ETF market is currently at its most compelling point in months. Inflow streaks have returned simultaneously for BTC, ETH, and SOL, while BlackRock’s recent launch of $ETHB signals that global financial institutions continue to invest in and drive the crypto space forward. Additionally, several on-chain indicators suggest the market is in a relatively low-risk zone.
However, history teaches that the crypto market can pivot at any time due to monetary policy, geopolitics, or unexpected selling pressure. Monitoring daily ETF flows remains essential, as it is one of the clearest indicators reflecting institutional sentiment.


.jpg)

.jpg)
.jpg)


